TJ's Take: Week 3 NFL DFS Recap

This is a free offering in our weekly content contained in the 4for4 DFS subscription. To get access to all of our weekly DFS analysis, sign up here!
Reviewing your own hits and misses each week is imperative if you want to be a profitable DFS player but examining winning lineups is also a useful exercise in cultivating a winning approach. Here I will analyze winning lineups from the biggest contests on FanDuel and DraftKings, teasing out lineup-building strategies and giving my analysis on how you could have landed on a similar team.
DraftKings Week 3 Millionaire Winning Lineup
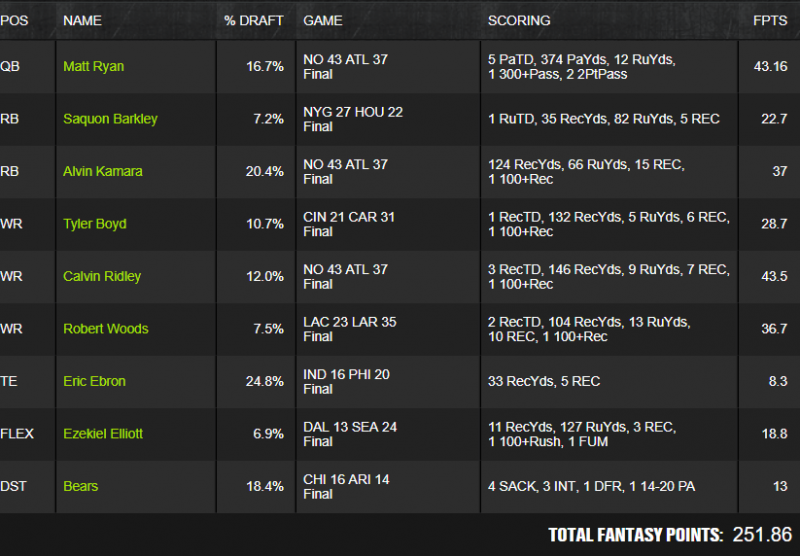
With just three entries in the Week 3 Millionaire, TheHodgesFactor paired one the most popular quarterbacks of the week with his secondary receiver. Julio Jones drew ownership nearly three times that of Calvin Ridley but the QB/WR2 correlation is the second-strongest player combo. To leverage both offenses in a game with a massive over/under, TheHodgesFactor added Alvin Kamara for a classic game stack.
Unlike the first two weeks, Week 3’s Millionaire winner stopped at a 3-man game stack, instead of going with a full onslaught, and focused on a trio of low-owned players that had underperformed relative to their volume.
What Were the Indicators for the Low-Owned Plays?
Week 3 was a great reminder that, even in short time periods, fantasy scoring usually reverts to volume-based expectation. Going into the week, Ezekiel Elliott and Saquon Barkley ranked one and two respectively, in percentage of team touches among active players. While their fantasy output had been good, their production was also overshadowed by monster starts by players like Alvin Kamara and Todd Gurley. Volume gives any running back tournament-winning upside, even when their teams don’t have massive scoring projections. Elliott and Barkley popped in last week’s leverage scores and were highlighted as running backs to target in my weekly slate breakdown.
Along with volume, air yards have proven to be a reliable predictor of production for receivers. Each week, Josh Hermsmeyer writes a free column highlighting players that are due for big weeks based on their air yards and usage. Robert Woods showed up in Josh’s model in consecutive weeks and Woods’ volume finally turned into a massive game. If you missed Josh’s article last week, the Rams passing game was one that I was targeting in tournaments.
FanDuel Week 3 Sunday Million Winning Lineup
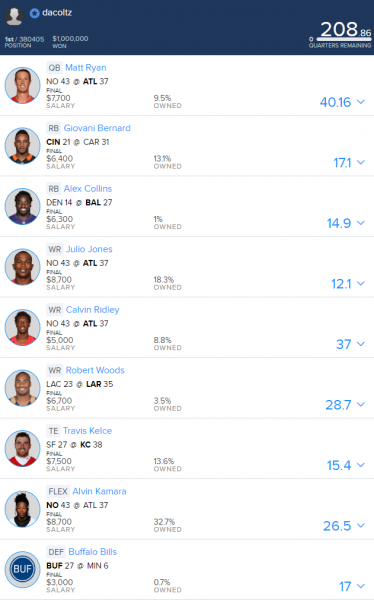
dacoltz was slightly more aggressive with his ATL/NO game stack compared to DraftKings’ million dollar winner, adding Julio Jones to the mix. While Julio put up mediocre results, this lineup is a reminder that zeroing in on the right game can take down a major tournament even if one of those players underperforms. Having some exposure to the high-powered Chiefs offense remained a must and with heavy ownership on Eric Ebron and similar price points for Travis Kelce and Zach Ertz, Kelce’s ownership stayed in check.
What Were the Indicators for the Low-Owned Plays?
Alex Collins hasn’t been the workhorse that most fantasy owners expected, but we’ve seen players win DFS tournaments before with decent performances from a running back in a timeshare—Phillip Lindsay was a great example in Week 2. Baltimore was a significant home favorite and game script allowed enough volume for both Collins and Buck Allen to turn in respectable performances.
The only argument for the Bills defense is that they were opposite a defense that was going to push 20 percent ownership, a massive number for any team defense. Though there were no indicators that this was the spot to go contrarian, this is a nod to the fact that defensive scoring is the highest variance of all roster spots and there should be differentiation in any lineup portfolio.
TJ’s Final Take
Seeing players like Zeke and Robert Woods pop in winning lineups is a warning against ignoring volume and a reminder to keep player performance in context. One way to do that—besides looking at raw volume—is to consider touch shares. Specifically, I look at percentage of team targets for pass catchers and percentage of backfield, and total team touches for running backs.
A running back who accounts for a huge portion of his team’s touches but is stuck in a mediocre offense, for example, could go overlooked in a week where his team might suddenly find themselves in a favorable game script.
Use the following touch shares as a guide to possibly uncover some of Week 4’s hidden gems:
| Player | W1 | W2 | W3 | % Team Touches | W1 | W2 | W3 | % RB Touches |
|---|---|---|---|---|---|---|---|---|
| Ezekiel Elliott | 43.9% | 53.7% | 50.0% | 49.2% | 94.7% | 100.0% | 100.0% | 98.3% |
| James Conner | 62.1% | 25.0% | 38.5% | 42.6% | 100.0% | 81.3% | 87.0% | 92.0% |
| Christian McCaffrey | 32.7% | 44.0% | 53.6% | 43.9% | 66.7% | 84.6% | 88.2% | 81.0% |
| Saquon Barkley | 43.5% | 50.0% | 42.3% | 45.3% | 80.0% | 86.2% | 73.3% | 79.8% |
| Kareem Hunt | 38.1% | 39.6% | 34.6% | 37.3% | 72.7% | 90.5% | 75.0% | 79.1% |
| Todd Gurley | 52.3% | 38.6% | 43.8% | 44.2% | 88.5% | 64.7% | 84.8% | 78.5% |
| Alvin Kamara | 34.0% | 37.3% | 47.0% | 40.1% | 81.0% | 65.5% | 81.6% | 76.1% |
| Carlos Hyde | 43.4% | 34.7% | 46.3% | 41.7% | 71.9% | 70.8% | 80.6% | 74.7% |
| Lamar Miller | 41.2% | 33.3% | 34.9% | 36.6% | 77.8% | 69.6% | 75.0% | 74.3% |
| Jordan Howard | 40.0% | 32.7% | 47.3% | 40.1% | 69.0% | 77.3% | 74.3% | 73.3% |
| Peyton Barber | 34.5% | 34.0% | 17.4% | 29.1% | 82.6% | 65.4% | 57.1% | 69.8% |
| David Johnson | 40.0% | 43.8% | 45.7% | 43.1% | 63.6% | 66.7% | 72.7% | 67.7% |
| Tevin Coleman | 25.6% | 36.4% | 35.4% | 33.1% | 52.6% | 66.7% | 77.3% | 66.2% |
| Melvin Gordon | 42.9% | 30.6% | 44.7% | 39.2% | 68.6% | 50.0% | 70.8% | 62.9% |
| Kenyan Drake | 34.7% | 31.3% | 21.9% | 30.2% | 65.4% | 60.0% | 53.8% | 60.9% |
| Jamaal Williams | 35.7% | 35.2% | 15.9% | 29.3% | 78.9% | 76.0% | 29.2% | 60.3% |
| Joe Mixon | 53.7% | 42.3% | - | 32.6% | 91.7% | 68.8% | - | 60.3% |
| Adrian Peterson | 44.4% | 25.5% | 40.4% | 37.0% | 66.7% | 43.8% | 67.9% | 59.8% |
| Chris Carson | 28.6% | 13.6% | 61.8% | 37.3% | 45.5% | 26.1% | 87.2% | 59.5% |
| T.J. Yeldon | 37.0% | 22.6% | 32.5% | 30.2% | 56.7% | 48.0% | 59.1% | 54.5% |
| Dalvin Cook | 42.3% | 24.5% | - | 23.2% | 66.7% | 72.2% | - | 53.0% |
| Marshawn Lynch | 25.0% | 35.7% | 37.3% | 32.9% | 39.4% | 62.5% | 56.4% | 52.9% |
| Dion Lewis | 42.9% | 31.3% | 25.0% | 33.1% | 65.6% | 45.5% | 40.0% | 50.5% |
| Derrick Henry | 22.4% | 37.5% | 37.5% | 32.4% | 34.4% | 54.5% | 60.0% | 49.5% |
| Alex Collins | 13.3% | 22.2% | 39.6% | 24.6% | 26.7% | 52.2% | 70.0% | 49.4% |
| Isaiah Crowell | 19.2% | 31.8% | 40.0% | 29.8% | 33.3% | 58.3% | 56.3% | 48.8% |
| Jordan Wilkins | 27.9% | 24.5% | 21.6% | 25.2% | 54.8% | 42.9% | 44.4% | 48.1% |
| Alfred Morris | 30.0% | 34.8% | 28.6% | 31.1% | 48.0% | 48.5% | 45.2% | 47.2% |
| Matt Breida | 30.0% | 30.4% | 26.5% | 28.9% | 48.0% | 42.4% | 41.9% | 43.8% |
| Bilal Powell | 25.0% | 22.7% | 31.1% | 26.2% | 43.3% | 41.7% | 43.8% | 43.0% |
| Kerryon Johnson | 18.2% | 25.0% | 30.0% | 25.0% | 38.1% | 41.9% | 45.0% | 42.4% |
| Chris Ivory | 9.4% | 7.3% | 43.4% | 23.0% | 17.6% | 14.3% | 71.9% | 41.4% |
| Royce Freeman | 26.3% | 17.0% | 30.4% | 24.7% | 41.7% | 29.6% | 48.3% | 40.2% |
| Giovani Bernard | 4.9% | 19.2% | 40.5% | 21.5% | 8.3% | 31.3% | 100.0% | 39.7% |
| Phillip Lindsay | 29.8% | 31.9% | 8.7% | 24.0% | 47.2% | 55.6% | 13.8% | 39.1% |
| Frank Gore | 18.4% | 20.8% | 18.8% | 19.4% | 34.6% | 40.0% | 46.2% | 39.1% |
| Corey Clement | 10.6% | 18.6% | 31.7% | 21.1% | 17.2% | 40.7% | 50.0% | 37.2% |
| Nyheim Hines | 19.7% | 10.2% | 27.0% | 18.4% | 38.7% | 17.9% | 55.6% | 35.1% |
| Javorius Allen | 15.0% | 20.4% | 17.0% | 17.4% | 30.0% | 47.8% | 30.0% | 34.9% |
| Austin Ekeler | 17.9% | 28.6% | 18.4% | 21.7% | 28.6% | 46.7% | 29.2% | 34.8% |
| Chris Thompson | 17.5% | 30.9% | 14.9% | 21.2% | 26.2% | 53.1% | 25.0% | 34.3% |
| LeGarrette Blount | 9.1% | 17.3% | 30.0% | 19.9% | 19.0% | 29.0% | 45.0% | 33.7% |
| Latavius Murray | 21.2% | 7.5% | 15.2% | 14.6% | 33.3% | 22.2% | 46.7% | 33.3% |
| Rex Burkhead | 33.3% | 12.5% | 6.1% | 19.6% | 51.4% | 21.4% | 8.3% | 30.3% |
| James White | 15.8% | 22.9% | 21.2% | 19.6% | 24.3% | 39.3% | 29.2% | 30.3% |
| LeSean McCoy | 25.0% | 31.7% | - | 16.7% | 47.1% | 61.9% | - | 30.0% |
| Ty Montgomery | 9.5% | 11.1% | 22.7% | 14.3% | 21.1% | 24.0% | 41.7% | 29.4% |
| Chase Edmonds | 22.9% | 18.8% | 14.3% | 18.6% | 36.4% | 28.6% | 22.7% | 29.2% |
| Sony Michel | - | 22.9% | 45.5% | 18.8% | - | 39.3% | 62.5% | 29.2% |
| Rashaad Penny | 31.4% | 22.7% | 5.5% | 17.9% | 50.0% | 43.5% | 7.7% | 28.6% |
| Marcus Murphy | 18.8% | 9.8% | 17.0% | 15.1% | 35.3% | 19.0% | 28.1% | 27.1% |
| Jay Ajayi | 31.9% | 13.6% | - | 13.9% | 51.7% | 29.6% | - | 24.5% |
| Tarik Cohen | 16.0% | 9.6% | 14.5% | 13.4% | 27.6% | 22.7% | 22.9% | 24.4% |
| Alfred Blue | 9.8% | 14.6% | 11.6% | 12.0% | 18.5% | 30.4% | 25.0% | 24.3% |
| Jacquizz Rodgers | 5.5% | 16.0% | 8.7% | 9.9% | 13.0% | 30.8% | 28.6% | 23.8% |
| Corey Grant | 2.2% | 18.9% | 17.5% | 12.9% | 3.3% | 40.0% | 31.8% | 23.4% |
| Theo Riddick | 20.5% | 17.3% | 5.0% | 13.5% | 42.9% | 29.0% | 7.5% | 22.8% |
| Wendell Smallwood | 0.0% | 13.6% | 21.7% | 12.7% | 0.0% | 29.6% | 34.2% | 22.3% |
| Doug Martin | 11.5% | 14.3% | 15.3% | 13.8% | 18.2% | 25.0% | 23.1% | 22.1% |
| Malcolm Brown | 6.8% | 21.1% | 7.8% | 12.1% | 11.5% | 35.3% | 15.2% | 21.5% |
| Jalen Richard | 26.9% | 3.6% | 10.2% | 13.2% | 42.4% | 6.3% | 15.4% | 21.2% |
| Ito Smith | - | 18.2% | 10.4% | 10.6% | - | 33.3% | 22.7% | 21.1% |
| Devontae Booker | 7.0% | 6.4% | 21.7% | 11.3% | 11.1% | 11.1% | 34.5% | 18.5% |
| Duke Johnson | 11.3% | 10.2% | 7.4% | 9.6% | 18.8% | 20.8% | 12.9% | 17.2% |
| Mike Gillislee | 6.0% | 15.7% | 4.5% | 8.4% | 14.3% | 27.6% | 7.9% | 15.9% |
| Kenneth Dixon | 21.7% | - | - | 7.8% | 43.3% | - | - | 15.7% |
| Leonard Fournette | 26.1% | - | - | 8.6% | 40.0% | - | - | 15.6% |
| C.J. Anderson | 14.3% | 6.0% | 5.4% | 8.4% | 29.2% | 11.5% | 8.8% | 15.5% |
| Marlon Mack | - | 22.4% | 0.0% | 7.5% | - | 39.3% | 0.0% | 14.3% |
| Wayne Gallman | 6.5% | 4.0% | 11.5% | 7.4% | 12.0% | 6.9% | 20.0% | 13.1% |
| Devonta Freeman | 23.1% | - | - | 6.3% | 47.4% | - | - | 12.7% |
| Spencer Ware | 9.5% | 2.1% | 5.8% | 5.6% | 18.2% | 4.8% | 12.5% | 11.9% |
| Aaron Jones | - | - | 15.9% | 5.0% | - | - | 29.2% | 10.3% |
| Player | Pos | Team | W1 | W2 | W3 | % Team Targets |
|---|---|---|---|---|---|---|
| Jarvis Landry | WR | CLE | 38.5% | 23.3% | 41.7% | 35.2% |
| Julio Jones | WR | ATL | 52.8% | 32.1% | 17.6% | 34.7% |
| DeAndre Hopkins | WR | HOU | 34.4% | 39.3% | 26.3% | 32.7% |
| Adam Thielen | WR | MIN | 34.3% | 27.1% | 34.5% | 31.9% |
| Quincy Enunwa | WR | NYJ | 47.6% | 26.8% | 26.7% | 31.5% |
| Michael Thomas | WR | NO | 39.5% | 37.1% | 20.4% | 31.5% |
| Odell Beckham | WR | NYG | 41.7% | 20.9% | 34.5% | 31.5% |
| Corey Davis | WR | TEN | 35.1% | 35.0% | 19.0% | 30.8% |
| Antonio Brown | WR | PIT | 39.0% | 28.3% | 23.7% | 30.2% |
| Alvin Kamara | RB | NO | 27.9% | 17.1% | 40.8% | 29.9% |
| Travis Kelce | TE | KC | 24.0% | 35.7% | 27.0% | 28.9% |
| Robert Woods | WR | LAR | 27.3% | 28.1% | 30.6% | 28.7% |
| Zach Ertz | TE | PHI | 31.3% | 27.7% | 27.0% | 28.4% |
| Christian McCaffrey | RB | CAR | 36.0% | 33.3% | 8.3% | 27.7% |
| JuJu Smith-Schuster | WR | PIT | 19.5% | 31.7% | 28.9% | 27.3% |
| Allen Robinson | WR | CHI | 20.6% | 41.2% | 20.0% | 27.2% |
| Mike Evans | WR | TB | 25.0% | 36.4% | 22.0% | 27.0% |
| T.Y. Hilton | WR | IND | 21.2% | 35.5% | 25.6% | 26.2% |
| Golden Tate | WR | DET | 29.4% | 25.0% | 22.9% | 26.1% |
| Saquon Barkley | RB | NYG | 16.7% | 37.2% | 17.2% | 25.0% |
| Demaryius Thomas | WR | DEN | 27.0% | 31.4% | 15.2% | 24.8% |
| Brandin Cooks | WR | LAR | 24.2% | 28.1% | 22.2% | 24.8% |
| Chris Thompson | RB | WAS | 24.1% | 31.8% | 10.0% | 24.7% |
| Davante Adams | WR | GB | 22.2% | 30.0% | 20.9% | 24.4% |
| Keenan Allen | WR | LAC | 22.0% | 29.6% | 23.3% | 24.3% |
| George Kittle | TE | SF | 28.1% | 17.4% | 23.3% | 23.5% |
| Nelson Agholor | WR | PHI | 31.3% | 25.5% | 13.5% | 23.3% |
| Randall Cobb | WR | GB | 27.8% | 15.0% | 25.6% | 22.7% |
| Melvin Gordon | RB | LAC | 26.0% | 25.9% | 13.3% | 22.4% |
| Devin Funchess | WR | CAR | 20.0% | 20.0% | 29.2% | 22.3% |
| Sammy Watkins | WR | KC | 20.0% | 25.0% | 21.6% | 22.2% |
| A.J. Green | WR | CIN | 28.6% | 22.5% | 17.8% | 22.1% |
| Emmanuel Sanders | WR | DEN | 29.7% | 11.4% | 24.2% | 21.9% |
| Larry Fitzgerald | WR | ARI | 32.3% | 21.7% | 8.3% | 21.8% |
| Jordan Reed | TE | WAS | 17.2% | 18.2% | 35.0% | 21.5% |
| Taylor Gabriel | WR | CHI | 14.7% | 20.6% | 28.6% | 21.4% |
| Tyreek Hill | WR | KC | 32.0% | 21.4% | 13.5% | 21.1% |
| Stefon Diggs | WR | MIN | 17.1% | 27.1% | 18.2% | 21.0% |
| Ezekiel Elliott | RB | DAL | 13.8% | 26.1% | 23.5% | 20.9% |
| Cooper Kupp | WR | LAR | 27.3% | 18.8% | 16.7% | 20.8% |
| Will Fuller | WR | HOU | - | 32.1% | 28.9% | 20.4% |
| Jared Cook | TE | OAK | 30.8% | 12.5% | 16.2% | 20.4% |
| Michael Crabtree | WR | BAL | 16.2% | 18.9% | 26.3% | 20.3% |
| Kenny Golladay | WR | DET | 23.5% | 17.3% | 20.0% | 20.3% |
| James White | RB | NE | 23.1% | 22.9% | 12.0% | 20.2% |
| Brandon Marshall | WR | SEA | 18.2% | 18.2% | 23.1% | 19.6% |
| David Johnson | RB | ARI | 29.0% | 8.7% | 16.7% | 19.2% |
| Christian Kirk | WR | ARI | 6.5% | 21.7% | 33.3% | 19.2% |
| Ricky Seals-Jones | TE | ARI | 19.4% | 26.1% | 12.5% | 19.2% |
| Phillip Dorsett | WR | NE | 17.9% | 20.0% | 20.0% | 19.2% |
| Keelan Cole | WR | JAX | 12.5% | 17.8% | 27.3% | 19.1% |
| Jakeem Grant | WR | MIA | 25.0% | 17.4% | 12.5% | 18.7% |
| Cole Beasley | WR | DAL | 27.6% | 13.0% | 14.7% | 18.6% |
| Tyler Boyd | WR | CIN | 17.9% | 22.5% | 15.6% | 18.6% |
| Tyler Lockett | WR | SEA | 12.1% | 21.2% | 23.1% | 18.5% |
| Chris Godwin | WR | TB | 14.3% | 18.2% | 20.0% | 18.0% |
| John Brown | WR | BAL | 10.8% | 18.9% | 23.7% | 18.0% |
| Sterling Shepard | WR | NYG | 19.4% | 11.6% | 24.1% | 17.6% |
| Danny Amendola | WR | MIA | 21.4% | 17.4% | 12.5% | 17.3% |
| Kenny Stills | WR | MIA | 17.9% | 13.0% | 20.8% | 17.3% |
| T.J. Yeldon | RB | JAX | 21.9% | 11.1% | 21.2% | 17.3% |
| Kelvin Benjamin | WR | BUF | 21.9% | 9.1% | 22.7% | 17.2% |
| Rob Gronkowski | TE | NE | 20.5% | 11.4% | 20.0% | 17.2% |
| Marvin Jones | WR | DET | 15.7% | 17.3% | 17.1% | 16.7% |
| Amari Cooper | WR | OAK | 7.7% | 31.3% | 13.5% | 16.7% |
| Jalen Richard | RB | OAK | 28.2% | 0.0% | 18.9% | 16.7% |
| Pierre Garcon | WR | SF | 18.8% | 17.4% | 13.3% | 16.5% |
| Eric Ebron | TE | IND | 9.6% | 12.9% | 28.2% | 16.4% |
| Kenyan Drake | RB | MIA | 14.3% | 17.4% | 16.7% | 16.0% |
| Jimmy Graham | TE | GB | 11.1% | 20.0% | 16.3% | 16.0% |
| Torrey Smith | WR | CAR | 8.0% | 15.6% | 25.0% | 16.0% |
| Theo Riddick | RB | DET | 13.7% | 23.1% | 8.6% | 15.9% |
| Donte Moncrief | WR | JAX | 15.6% | 20.0% | 9.1% | 15.5% |
| Dion Lewis | RB | TEN | 21.6% | 5.0% | 14.3% | 15.4% |
| Mohamed Sanu | WR | ATL | 16.7% | 7.1% | 20.6% | 15.3% |
| David Njoku | TE | CLE | 17.9% | 23.3% | 5.6% | 15.2% |
| Terrelle Pryor | WR | NYJ | 14.3% | 19.5% | 10.0% | 15.2% |
| Geronimo Allison | WR | GB | 22.2% | 15.0% | 9.3% | 15.1% |
| Paul Richardson | WR | WAS | 20.7% | 13.6% | 10.0% | 15.1% |
| Giovani Bernard | RB | CIN | 3.6% | 17.5% | 20.0% | 15.0% |
| Ted Ginn | WR | NO | 14.0% | 20.0% | 12.2% | 15.0% |
| Willie Snead | WR | BAL | 16.2% | 15.1% | 13.2% | 14.8% |
| Jordy Nelson | WR | OAK | 10.3% | 12.5% | 21.6% | 14.8% |
| Albert Wilson | WR | MIA | 14.3% | 21.7% | 8.3% | 14.7% |
| Trey Burton | TE | CHI | 17.6% | 11.8% | 14.3% | 14.6% |
| Antonio Callaway | WR | CLE | 2.6% | 13.3% | 27.8% | 14.3% |
| Chris Hogan | WR | NE | 12.8% | 14.3% | 16.0% | 14.1% |
| Will Dissly | TE | SEA | 15.2% | 15.2% | 11.5% | 14.1% |
| Mike Williams | WR | LAC | 12.0% | 7.4% | 23.3% | 14.0% |
| Josh Doctson | WR | WAS | 10.3% | 15.9% | 15.0% | 14.0% |
| Deonte Thompson | WR | DAL | 17.2% | 21.7% | 5.9% | 14.0% |
| Todd Gurley | RB | LAR | 15.2% | 9.4% | 16.7% | 13.9% |
| Jarius Wright | WR | CAR | 20.0% | 15.6% | 4.2% | 13.8% |
| Austin Seferian-Jenkins | TE | JAX | 15.6% | 11.1% | 15.2% | 13.6% |
| Dede Westbrook | WR | JAX | 18.8% | 11.1% | 12.1% | 13.6% |
| Rashard Higgins | WR | CLE | 10.3% | 23.3% | 8.3% | 13.3% |
| Courtland Sutton | WR | DEN | 13.5% | 17.1% | 9.1% | 13.3% |
| Javorius Allen | RB | BAL | 16.2% | 13.2% | 10.5% | 13.3% |
| Tyler Eifert | TE | CIN | 10.7% | 10.0% | 17.8% | 13.3% |
| Austin Hooper | TE | ATL | 11.1% | 17.9% | 11.8% | 13.3% |
| Calvin Ridley | WR | ATL | 0.0% | 17.9% | 23.5% | 13.3% |
| Nick Vannett | TE | SEA | 6.1% | 15.2% | 19.2% | 13.0% |
| Jamison Crowder | WR | WAS | 13.8% | 9.1% | 20.0% | 12.9% |
| Geoff Swaim | TE | DAL | 13.8% | 0.0% | 20.6% | 12.8% |
| O.J. Howard | TE | TB | 7.1% | 12.1% | 16.0% | 12.6% |
| DeSean Jackson | WR | TB | 17.9% | 12.1% | 10.0% | 12.6% |
| Jake Butt | TE | DEN | 10.8% | 17.1% | 9.1% | 12.4% |
| Jack Doyle | TE | IND | 19.2% | 16.1% | - | 12.3% |
| Ryan Grant | WR | IND | 17.3% | 6.5% | 10.3% | 12.3% |
| Nyheim Hines | RB | IND | 17.3% | 3.2% | 12.8% | 12.3% |
| Bruce Ellington | WR | HOU | 25.0% | 10.7% | 2.6% | 12.2% |
| James Conner | RB | PIT | 14.6% | 8.3% | 15.8% | 12.2% |
| Evan Engram | TE | NYG | 13.9% | 16.3% | 3.4% | 12.0% |
| Ben Watson | TE | NO | 9.3% | 14.3% | 12.2% | 11.8% |
| Kyle Juszczyk | RB | SF | 6.3% | 17.4% | 13.3% | 11.8% |
| Trent Taylor | WR | SF | 18.8% | 0.0% | 13.3% | 11.8% |
| Kyle Rudolph | TE | MIN | 5.7% | 16.7% | 10.9% | 11.6% |
| Chase Edmonds | RB | ARI | 12.9% | 21.7% | 0.0% | 11.5% |
| Taywan Taylor | WR | TEN | 0.0% | 20.0% | 23.8% | 11.5% |
| John Ross | WR | CIN | 7.1% | 10.0% | 15.6% | 11.5% |
| Zay Jones | WR | BUF | 18.8% | 9.1% | 4.5% | 11.5% |
| Robby Anderson | WR | NYJ | 4.8% | 12.2% | 13.3% | 10.9% |
| Adam Humphries | WR | TB | 17.9% | 6.1% | 10.0% | 10.8% |
| Jordan Howard | RB | CHI | 14.7% | 11.8% | 5.7% | 10.7% |
| Anthony Miller | WR | CHI | 8.8% | 8.8% | 14.3% | 10.7% |
| Ian Thomas | TE | CAR | 8.0% | 6.7% | 20.8% | 10.6% |
| Matt Breida | RB | SF | 6.3% | 17.4% | 10.0% | 10.6% |
| Allen Hurns | WR | DAL | 10.3% | 8.7% | 11.8% | 10.5% |
| Andre Holmes | WR | BUF | 3.1% | 12.1% | 18.2% | 10.3% |
| Austin Ekeler | RB | LAC | 10.0% | 11.1% | 10.0% | 10.3% |
| Tyrell Williams | WR | LAC | 10.0% | 11.1% | 10.0% | 10.3% |
| Ryan Griffin | TE | HOU | 15.6% | 3.6% | 10.5% | 10.2% |
| Lamar Miller | RB | HOU | 6.3% | 7.1% | 15.8% | 10.2% |
| Laquon Treadwell | WR | MIN | 11.4% | 12.5% | 7.3% | 10.1% |
| Ty Montgomery | RB | GB | 8.3% | 5.0% | 16.3% | 10.1% |
Photo by Daniel Shirey/Getty Images.