An SFB11 Strategy Guide—How League Settings Impact Scoring

For most people summer is synonymous with pool parties, popsicles, music festivals and slip-n-slides. However, in the fantasy football community, it signifies the start of the Scott Fish Bowl, a massive charity-based tournament that usually kicks off around July 4th.
This year’s version, SFB11, will feature 1,920 fantasy football enthusiasts comprised of industry professionals, fanalysts and folks who just love to play fantasy football. There are even some celebrities in the form of actors, musicians and professional athletes. The tournament has grown from its humble beginnings over the past decade, but the charity component, masterful scoring configuration created by Fish and healthy competition are all still a massive part of this cherished community event.
SFB11 is set up in a way for so many different approaches to be successful, but thanks to data run by TJ Hernandez I will provide some insight into this macro-tournament based on sticky correlations from previous seasons, along with the scoring structure for 2021’s version.
Editor's Note: This year's SFB Podathon will donate proceeds of their fundraiser to Toys for Tots and The Trevor Project. Donate here to help two worthy causes.
The League Settings
Getting familiar with a league’s format and scoring system is imperative when starting any fantasy football draft, and SFB11 is certainly no exception. Rolling in with your normal cheat sheets will not serve you well here.
Managers will be drafting 22 total players, with 11 starting each week. Weekly lineups will consist of 1 QB, 2 RBs, 3 WRs, 1 TE and 4 flex spots. Those flex spots can be QB, RB, WR, TE or K, with only one QB maximum in a flex spot.
There are no defenses, no trading and weekly waivers are done via blind bid with a $100 budget for the season. One note of significance in this year’s draft is that there’s a third-round reversal, meaning the direction of the snake draft reverses at the end of the second round, so the team in the 12th spot selects again to begin Round 3. The draft then continues to snake with no further reversals.
SFB11 Scoring
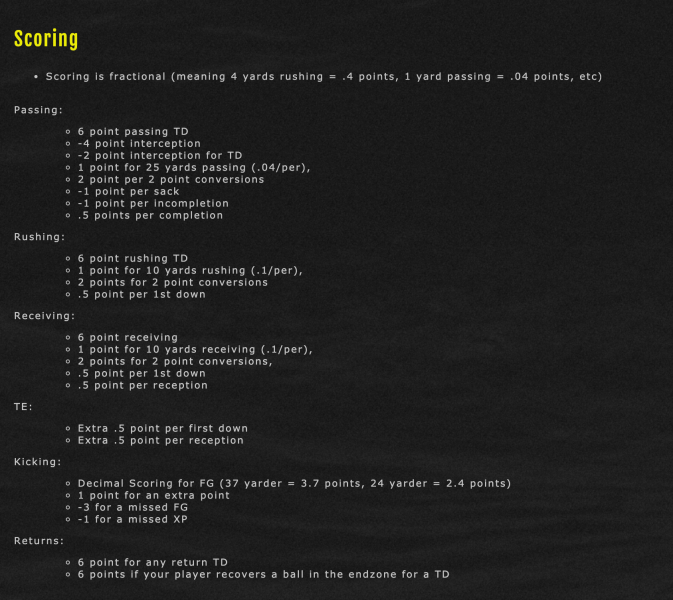
If you played in last year’s tournament you’ll see that the scoring remains mostly the same, with the addition of kicker points in the flex, along with a player’s ability to score points for a return touchdown or a recovery in the end zone for a touchdown.
We still have half-point scoring for first downs and receptions for running backs and wide receivers, with a full point granted for tight ends in both of those categories.
Quarterbacks also get a half of a point for a rushing first down, plus another for a completion, but lose a full point for both a sack and an incomplete pass. They receive six points for a passing touchdown but lose four points per interception (with an additional two points lost for a pick-six).
To get an overview of how SFB11 scoring may look like by position this season, check out this chart plotting 2020 fantasy points based on this year's scoring.
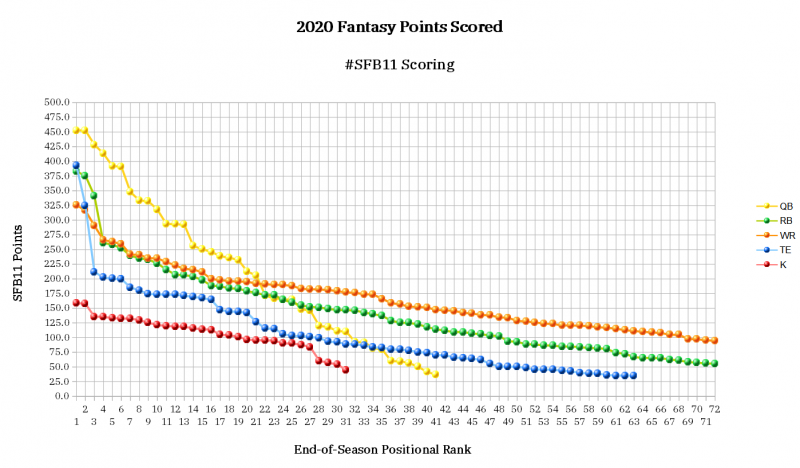
Now let’s get into some of TJ’s findings and explore what we can tease out to help us in our quest to take down the SFB11 tournament. Later in the article, I will use the chart above to explain how positions relate to each other, especially the newly added kickers.
First Down Data
Considering all positions except for the optional kicker get varying points per first down, looking at the year-to-year correlations for both rushing and receiving first downs to see what’s sticky may be beneficial when deciding just who to draft.
TJ ran the numbers before last year’s SFB based on a five-year span of data.
For those participating in #SFBX or any point per first down league, here are the year-to-year correlations by position over the last five years.
Rush FD % = FD/RushAtt
Rec FD % = FD/Targets pic.twitter.com/2WMz6eXgj9— TJ Hernandez (@TJHernandez) June 28, 2020
As we can see, receiving first downs are generally quite sticky, especially for wide receivers and tight ends. Intuitively this makes sense—there is generally less turnover at those positions than at running back and first downs are a function of volume. We already know that volume for pass-catchers is one of the stickiest year-to-year stats around.
4for4 conveniently has projections for rushing first downs for all positions besides kicker, of course, receiving first downs for RB, WR and TEs, and passing first down projections for QBs.
How SFB11 Settings Impact Stats that Matter
By comparing how in-game stats correlate to half-PPR points and how those stats then correlate to SFB scoring, we can get an idea of how SFB scoring emphasizes specific stats or player types. First down data was left out since it is not factored into traditional half-PPR scoring systems.
What we found is that when it comes to WR and RB, SFB scoring has very little to no impact on which stats correlate strongly with fantasy scoring when compared to traditional scoring formats.
However, where SFB changes things is at the quarterback position, giving a decent bump to accurate passers, in particular ones who don’t throw many picks.
| Stat | Correlation to .5 PPR FPs | Corelation to SFB11 FPs | Difference |
|---|---|---|---|
| Comp % | 0.45 | 0.68 | +0.23 |
| YPA | 0.53 | 0.59 | +0.06 |
| TD % | 0.63 | 0.69 | +0.06 |
| Pass TD | 0.75 | 0.76 | +0.01 |
| Pass Completions | 0.52 | 0.51 | +0.01 |
| Rush Att | 0.28 | 0.22 | -0.06 |
| Pass Yds | 0.67 | 0.61 | -0.06 |
| Rush Yds | 0.31 | 0.21 | -0.10 |
| Rush TD | 0.42 | 0.30 | -0.12 |
| Pass Att | 0.37 | 0.24 | -0.14 |
| Pass Int | -0.29 | -0.43 | -0.14 |
| Air Yards | 0.33 | 0.15 | -0.18 |
| Pass Inc | -0.01 | -0.28 | -0.27 |
Data shows that the completion efficiency correlates to SFB points at almost the same rate as touchdown percentage—which is intuitive due to points for completion and negative points for interceptions and incompletions (see the negative correlation above)—but this research quantifies that insight.
With the uptick in value for high-completion passers, however, we see a downtick in how valuable the rushing QBs are—all rushing stats saw a drop in correlation to SFB points for QBs compared to traditional scoring. This doesn’t include rushing first downs so the elite rushing QBs are still to be coveted, like Lamar Jackson, Kyler Murray, Jalen Hurts and Josh Allen who all lead John Paulsen’s projections for QB rushing first downs with 63.7, 43.7, 42.6 and 27.8 respectively. It’s the signal-callers who’ll run 15-20 yards per game that fall back to the same tier with the efficient QBs who aren’t mobile.
While we’re on the subject of QBs, those with stronger offensive lines and the ability to avoid sacks could be at more of an advantage than QBs who find themselves with dirtier uniforms, considering you lose a full point per sack. When looking at sack data from the past five seasons, there was a strong correlation in pressure rate—sacks can be subject to variance while pressure is usually consistent—so try to avoid those with low-pressure rates when choosing your QBs.
| Stat | Year-to-Year Correlation |
|---|---|
| Pressure Rate | 0.54 |
| Pressures | 0.34 |
| Sack Rate | 0.33 |
| Sacks | 0.23 |
Data set includes all QBs with at least 150 dropbacks in consecutive seasons (SportsInfoSolutions)
According to SportsInfoSolutions, SFB-relevant QBs with the lowest pressure rates last season were Ben Roethlisberger (21.2%), Tom Brady (24.9%), Aaron Rodgers (25.8%), Kyler Murray (27.5%) and Matthew Stafford (27.8%). Meanwhile Daniel Jones, Sam Darnold and Kirk Cousins all saw pressure rates above 40%.
SFB scoring also proved to be favorable for tight ends across the various in-game stat categories.
| Stat | Correlation vs. .5 PPR | Correlation vs SFB | Difference |
|---|---|---|---|
| Receptions | 0.74 | 0.83 | +0.09 |
| Targets | 0.63 | 0.71 | +0.08 |
| Rec Yards | 0.81 | 0.87 | +0.06 |
| Air Yards | 0.58 | 0.62 | +0.04 |
| Air Yards Share | 0.50 | 0.54 | +0.04 |
| aDOT | 0.18 | 0.15 | -0.03 |
| Rec TDs | 0.78 | 0.68 | -0.10 |
Almost every stat correlated higher for SFB, with receptions, targets and receiving yards sticking the most. With TE-premium scoring, volume becomes even more important for TEs than WRs when compared to half-PPR scoring while slightly de-emphasizing touchdowns for TEs, but not by much.
Besides the top-tier, high-volume TEs (Travis Kelce, Darren Waller and George Kittle), this data supports guys like T.J. Hockenson, Mark Andrews, Kyle Pitts, Noah Fant, Dallas Goedert, Irv Smith Jr. and Cole Kmet who are projected as TE4-TE10 in total receptions for 2021.

The Kicker Factor
Those of you who follow my work know I am one of the very few kicker proponents among a sea of analysts who campaign every season to ban them from fantasy football. Scott Fish’s decision to add the ability to start a kicker in one of the flex spots is a welcome change and one that you should embrace.
For more info on why I like to use kicker scoring and how to go about choosing them, check out my article on Debunking the Randomness of Kickers in Fantasy Football.
When it comes to SFB scoring, if we calculate where kickers fell based on last year’s output, we see that many of them produced similar points in this format to their fellow positional players.
| Player | Pos | Team | SFB Points |
|---|---|---|---|
| James Conner | RB | PIT | 164.40 |
| Jonnu Smith | TE | TEN | 164.40 |
| Chase Edmonds | RB | ARI | 159.50 |
| Jason Sanders | K | MIA | 159.00 |
| Michael Gallup | WR | DAL | 158.90 |
| Younghoe Koo | K | ATL | 157.70 |
| Jamison Crowder | WR | NYJ | 156.42 |
| Giovani Bernard | RB | CIN | 154.90 |
| Marquise Brown | WR | BAL | 152.90 |
| J.K. Dobbins | RB | BAL | 152.50 |
| Chris Godwin | WR | TB | 152.20 |
| Myles Gaskin | RB | MIA | 151.50 |
| Russell Gage | WR | ATL | 151.36 |
| Devin Singletary | RB | BUF | 148.80 |
| Dak Prescott | QB | DAL | 148.14 |
| Austin Ekeler | RB | LAC | 147.20 |
| Tyler Higbee | TE | LAR | 147.10 |
| T.Y. Hilton | WR | IND | 147.00 |
| Latavius Murray | RB | NO | 146.70 |
| Tim Patrick | WR | DEN | 146.60 |
| Mitch Trubisky | QB | CHI | 146.42 |
| Darrell Henderson | RB | LAR | 146.30 |
| D.J. Chark | WR | JAX | 145.60 |
| Dallas Goedert | TE | PHI | 144.40 |
| George Kittle | TE | SF | 144.30 |
| Gus Edwards | RB | BAL | 142.70 |
| DeVante Parker | WR | MIA | 142.20 |
| Jared Cook | TE | NO | 142.10 |
| Keelan Cole | WR | JAX | 141.10 |
| Wayne Gallman | RB | NYG | 140.10 |
| Julio Jones | WR | ATL | 138.60 |
| Christian Kirk | WR | ARI | 137.90 |
| Jeff Wilson | RB | SF | 137.00 |
| Jason Myers | K | SEA | 135.80 |
| Daniel Carlson | K | LVR | 135.50 |
| Emmanuel Sanders | WR | NO | 134.50 |
| Darius Slayton | WR | NYG | 133.80 |
| Rodrigo Blankenship | K | IND | 133.20 |
| Tyler Bass | K | BUF | 132.60 |
| Graham Gano | K | NYG | 132.40 |
| Justin Tucker | K | BAL | 130.00 |
| Jamaal Williams | RB | GB | 129.00 |
| Jerry Jeudy | WR | DEN | 128.60 |
| Mike Williams | WR | LAC | 127.40 |
| Austin Hooper | TE | CLE | 126.80 |
| Laviska Shenault | WR | JAX | 126.00 |
| Cairo Santos | K | CHI | 125.40 |
| Leonard Fournette | RB | TB | 125.30 |
| Adrian Peterson | RB | DET | 125.20 |
| Darnell Mooney | WR | CHI | 123.80 |
| Zach Pascal | WR | IND | 123.30 |
| Jerick McKinnon | RB | SF | 122.60 |
| Harrison Butker | K | KC | 121.60 |
| Jakobi Meyers | WR | NE | 120.76 |
| Marquez Valdes-Scantling | WR | GB | 120.70 |
| Mecole Hardman | WR | KC | 120.60 |
| Greg Zuerlein | K | DAL | 119.90 |
| Andy Dalton | QB | DAL | 119.84 |
| Sterling Shepard | WR | NYG | 119.40 |
| Ryan Succop | K | TB | 119.10 |
| Brandon McManus | K | DEN | 118.60 |
Using decimal scoring for field goals (37 yarders = 3.7 points) and one point per extra point, along with negative three points per missed field goal and one negative point for a missed extra pointer, we see that Jason Sanders and Younghoe Koo, who tied for the most fantasy points in 2020, were within the range of RB3, WR3 and TE2.
The next batch of kickers, and there were seven of them, were still within TE2 and RB3 numbers, but fell to WR4 with the likes of Julio Jones, Christian Kirk, Emmanuel Sanders and Jerry Jeudy. Expanding to the top 14 kickers in SFB points, they all still landed in the same points bracket as a TE2, RB4 and WR5.
I know people’s first inclination is to ignore kickers, but a large percentage of them, not only those on high-scoring offenses, are showing comparable SFB point output to players who will most certainly be drafted in this 22-round tournament. Skipping a team’s WR3/4 in the hopes they hit, or a third backfield option banking on an injury in favor of a kicker may prove beneficial to your squad over the course of the season.
Should We Care About Return Points?
If SFB counted return yards in weekly scoring, adding this research to the mix would make sense when choosing players. However, since only the touchdowns scored are factored in, there’s no real advantage based on past data.
Nyheim Hines and Jamal Agnew are the only players to find the endzone more than once per season on either a punt or kick return in the last two years, and both only had two in 2019 (Hines on two punt returns and Agnew with one of each).
Here’s a list of some notable returners and their touchdown output in 2019-2020.
| Player | Punt | Kick | Year |
|---|---|---|---|
| Nyheim Hines | 2 | 0 | 2019 |
| Diontae Johnson | 1 | 2019 | |
| Deonte Harris | 1 | 2019 | |
| Jamal Agnew | 2 | 1 | 2019/2020 |
| Steven Sims | 1 | 2019 | |
| Cordarrelle Patterson | 2 | 2019/2020 | |
| Mecole Hardman | 1 | 1 | 2019/2020 |
| Jakeem Grant | 1 | 1 | 2019/2020 |
| Jalen Reagor | 1 | 2020 | |
| Keelan Cole | 1 | 2020 | |
| Byron Pringle | 1 | 2020 | |
| CeeDee Lamb | 1 | 2020 | |
| A.J. Brown | 1 | 2020 |
Bottom Line
- SFB11 will consist of 22 rounds with a third-round reversal component new this season. Drafters also have the option to use a kicker in the flex in 2021.
- First down data has proven to be very sticky from year to year for pass-catchers, with WRs seeing over 40 targets and TEs with over 30 balls showing the highest correlations.
- SFB settings have little impact on which stats are relevant to RB and WR scoring when compared to traditional formats, while QB and TE proved otherwise.
- Choosing highly accurate passers and the most mobile of QBs should provide an advantage over the middle-of-the-road rushing QBs, who show the same potential productivity as efficient, non-mobile QBs.
- Don’t blow off kickers based on preconceived ideas, as they have the potential to put up as many SFB points as some of the mid-to-later round positional players.