TJ's #Taek: Week 6 NFL DFS Recap

Week 6’s winning lineups from the biggest contests on FanDuel and DraftKings can be used to tease out lineup-building strategies and offer clues on how you could have landed on a similar team. Reviewing your hits and misses each week is imperative if you want to be a profitable DFS player but examining winning lineups is also a useful exercise in cultivating a winning approach.
DraftKings Week 6 Millionaire Winning Lineup
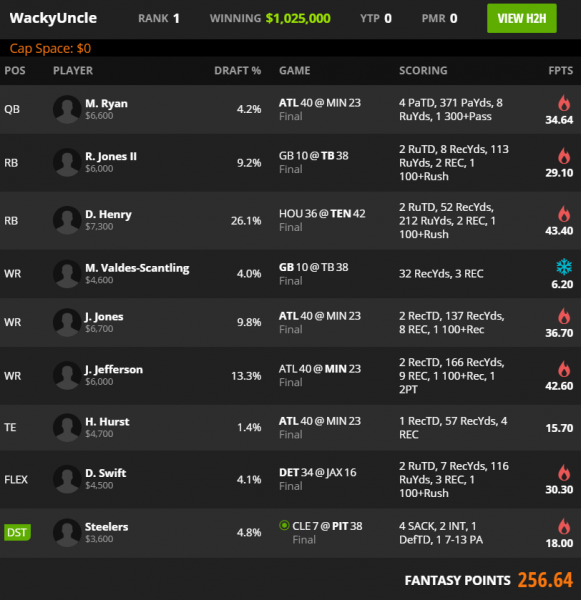
The average ownership of this week’s winning Millionaire lineup was just 8.5%, the lowest of the season, and the third-lowest since the beginning of 2019. WackyUncle rostered just two players that were in 10% or more lineups. The roster build was nothing new, though, as this was the fourth winner to use four players from one game and the third time in as many weeks that the winning lineup had at least six players with some correlation to another player in the lineup.
This lineup slanted towards a studs and duds approach in terms of salary with three non-defense spots carrying a salary below $5,000. Overall though, Millionaire winners have been using a balanced salary distribution—no position in winning lineups has an average salary above $7,000 and only the flex spot and defense have an average salary below $5,000.
What Were the Indicators for the Low-Owned Plays?
With most of the elite quarterback options off the main slate and no team projected to score 30 or more points, this was a great week to target contrarian stacks. The Vikings carried the highest projected team ownership by a huge margin so it was a savvy contrarian play to target the other side of it and stack the Falcons high-volume passing game, especially with Julio Jones healthy. The last time Julio played a full game, there was a three-way tie for the team lead in targets so it made sense to pair Matt Ryan with multiple pass-catchers and run it back with a chalky Minnesota receiver.
Ronald Jones and D'Andre Swift were both classic leverage plays off of passing offenses projected for high ownership. Jones didn’t necessarily need game script to break as perfectly as he did since he was already expected to see most of the backfield work in a game with a high over/under and small spread. Marquez Valdes-Scantling didn’t offer much as a secondary stack with Jones but this is just a reminder that you don’t have to be perfect to win even the biggest tournaments.
Swift was a much riskier play with Adrian Peterson still accounting for about half of the backfield work, but a running back timeshare is a good way to get low ownership in an offense that is expected to score a lot of points.
FanDuel Week 6 Sunday Million Winning Lineup
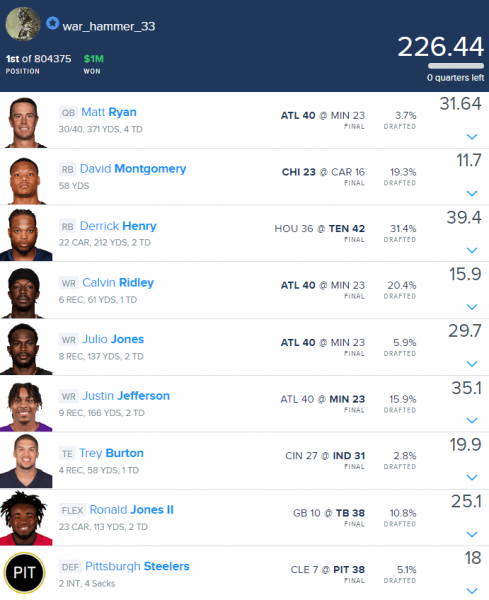
As has been the case for most of the season, the wide-open salary structure on FanDuel allows for a less contrarian approach than one needs in DraftKings tournaments with tighter salaries. Ironically, the loose salaries on FanDuel helped keep Trey Burton’s ownership percentage low since most players could afford to pay up at tight end and still make the lineup of their choice. On DraftKings, the savings on a player like Burton drove his ownership near 15%. With Mo Alie-Cox out and Burton seeing an increased role in recent weeks, it was expected that Burton would see starter-level volume at a low salary.
TJ’s Final #Taek
In weeks past, this space has touched on the fact that the different salary structures on FanDuel and DraftKings can impact expected ownership and that was especially notable in Week 6. Consider the players with the biggest discrepancies in ownership between this week’s Sunday Million and Millionaire.
| Player | Position | DK Salary | FD Salary | DK Own | FD Own | Diff |
|---|---|---|---|---|---|---|
| Dolphins | DST | $2,900 | $4,400 | 33.0% | 19.4% | -13.6% |
| Trey Burton | TE | $3,100 | $4,700 | 14.4% | 2.8% | -11.6% |
| Myles Gaskin | RB | $5,400 | $5,700 | 26.1% | 16.5% | -9.6% |
| Phillip Lindsay | RB | $4,300 | $5,100 | 12.2% | 2.8% | -9.4% |
| Irv Smith Jr. | TE | $2,500 | $4,300 | 10.5% | 2.1% | -8.4% |
| Chase Claypool | WR | $5,200 | $5,500 | 27.6% | 21.4% | -6.2% |
| Travis Fulgham | WR | $4,400 | $5,300 | 10.3% | 4.1% | -6.2% |
| Devonta Freeman | RB | $4,900 | $5,600 | 8.5% | 2.8% | -5.7% |
| A.J. Brown | WR | $5,600 | $6,500 | 22.2% | 16.9% | -5.3% |
| Eric Ebron | TE | $4,100 | $5,200 | 9.3% | 4.0% | -5.3% |
| Terry McLaurin | WR | $5,700 | $6,900 | 10.8% | 5.5% | -5.3% |
| Julio Jones | WR | $6,700 | $8,200 | 9.8% | 4.9% | -4.9% |
| Brandin Cooks | WR | $5,000 | $5,700 | 10.6% | 5.9% | -4.7% |
| Antonio Gibson | RB | $5,500 | $5,800 | 8.9% | 4.8% | -4.1% |
| Chris Godwin | WR | $6,400 | $7,700 | 9.7% | 6.0% | -3.7% |
| Ryan Tannehill | QB | $5,900 | $7,300 | 10.3% | 6.9% | -3.4% |
| Cam Newton | QB | $6,500 | $8,000 | 7.9% | 4.7% | -3.2% |
| Preston Williams | WR | $4,700 | $5,400 | 5.4% | 2.3% | -3.1% |
| Austin Hooper | TE | $3,900 | $5,200 | 4.5% | 1.4% | -3.1% |
| Ryan Fitzpatrick | QB | $5,900 | $7,400 | 14.8% | 12.6% | -2.2% |
| Jamison Crowder | WR | $6,100 | $6,600 | 15.2% | 13.2% | -2.0% |
| Darren Fells | TE | $3,800 | $5,100 | 3.1% | 1.2% | -1.9% |
| Laviska Shenault | WR | $5,200 | $5,800 | 7.9% | 6.1% | -1.8% |
| Kirk Cousins | QB | $6,100 | $7,100 | 10.6% | 8.8% | -1.8% |
| Tee Higgins | WR | $4,700 | $5,500 | 2.7% | 1.0% | -1.7% |
| Jerry Jeudy | WR | $5,500 | $5,700 | 2.2% | 0.6% | -1.6% |
| David Johnson | RB | $5,400 | $6,400 | 3.6% | 2.1% | -1.5% |
| Marvin Jones | WR | $5,100 | $5,800 | 4.2% | 2.8% | -1.4% |
| Julian Edelman | WR | $5,600 | $6,200 | 3.1% | 1.7% | -1.4% |
| Tom Brady | QB | $6,500 | $7,500 | 4.7% | 3.4% | -1.3% |
| Jarvis Landry | WR | $4,900 | $5,600 | 2.4% | 1.1% | -1.3% |
| Browns | DST | $2,700 | $4,300 | 1.4% | 0.3% | -1.1% |
| David Montgomery | RB | $5,800 | $5,900 | 24.2% | 23.1% | -1.1% |
| Joe Mixon | RB | $6,200 | $6,900 | 4.5% | 3.6% | -0.9% |
| Carson Wentz | QB | $5,600 | $7,000 | 1.1% | 0.2% | -0.9% |
| Zach Ertz | TE | $5,000 | $6,000 | 3.9% | 3.2% | -0.7% |
| Evan Engram | TE | $4,900 | $5,600 | 6.7% | 6.1% | -0.6% |
| Titans | DST | $2,800 | $4,000 | 3.8% | 3.2% | -0.6% |
| Joe Flacco | QB | $5,100 | $6,500 | 0.6% | 0.1% | -0.5% |
| Joe Burrow | QB | $5,400 | $7,100 | 0.8% | 0.4% | -0.4% |
| Baker Mayfield | QB | $5,700 | $7,000 | 0.5% | 0.1% | -0.4% |
| WAS Football Team | DST | $3,300 | $4,600 | 5.9% | 5.5% | -0.4% |
| Nick Foles | QB | $5,800 | $6,900 | 0.8% | 0.5% | -0.3% |
| Eagles | DST | $2,600 | $3,600 | 0.6% | 0.3% | -0.3% |
| Kyle Allen | QB | $5,100 | $6,400 | 0.7% | 0.4% | -0.3% |
| Steelers | DST | $3,600 | $4,500 | 4.9% | 4.6% | -0.2% |
| Texans | DST | $2,700 | $3,800 | 0.4% | 0.2% | -0.2% |
| Philip Rivers | QB | $5,900 | $6,800 | 0.3% | 0.2% | -0.1% |
| D.J. Moore | WR | $5,900 | $6,800 | 1.7% | 1.6% | -0.1% |
| Drew Lock | QB | $5,400 | $6,700 | 0.2% | 0.1% | -0.1% |
| Teddy Bridgewater | QB | $6,000 | $6,900 | 1.1% | 1.1% | +0.0% |
| Jaguars | DST | $2,800 | $3,600 | 0.4% | 0.4% | +0.0% |
| Tyler Boyd | WR | $5,800 | $6,100 | 2.2% | 2.3% | +0.1% |
| Daniel Jones | QB | $5,400 | $6,700 | 1.6% | 1.7% | +0.1% |
| Hayden Hurst | TE | $4,700 | $5,400 | 1.5% | 1.6% | +0.2% |
| Darius Slayton | WR | $5,400 | $6,000 | 3.6% | 3.8% | +0.2% |
| Packers | DST | $3,700 | $4,200 | 0.4% | 0.8% | +0.4% |
| Matt Ryan | QB | $6,600 | $7,400 | 4.2% | 4.6% | +0.4% |
| Odell Beckham | WR | $6,400 | $6,700 | 4.6% | 5.1% | +0.5% |
| Todd Gurley | RB | $6,300 | $6,800 | 6.8% | 7.4% | +0.6% |
| Ben Roethlisberger | QB | $6,700 | $7,600 | 6.8% | 7.7% | +0.9% |
| Miles Sanders | RB | $6,600 | $7,600 | 2.5% | 3.6% | +1.1% |
| JuJu Smith-Schuster | WR | $6,600 | $7,100 | 7.5% | 8.8% | +1.3% |
| Aaron Jones | RB | $7,600 | $8,500 | 14.1% | 15.6% | +1.6% |
| Gardner Minshew | QB | $6,400 | $7,200 | 2.2% | 4.0% | +1.8% |
| Robert Tonyan | TE | $5,100 | $6,200 | 7.9% | 9.8% | +1.9% |
| Lions | DST | $3,000 | $3,400 | 0.9% | 2.8% | +1.9% |
| Matthew Stafford | QB | $6,300 | $7,300 | 11.8% | 13.8% | +2.0% |
| Aaron Rodgers | QB | $7,500 | $8,400 | 8.0% | 10.0% | +2.0% |
| Justin Jefferson | WR | $6,000 | $5,900 | 13.3% | 15.5% | +2.2% |
| Mike Evans | WR | $6,900 | $7,600 | 5.2% | 8.0% | +2.8% |
| T.J. Hockenson | TE | $5,300 | $5,700 | 5.3% | 8.3% | +3.0% |
| DeVante Parker | WR | $6,300 | $6,400 | 10.1% | 13.5% | +3.4% |
| Lamar Jackson | QB | $7,700 | $9,000 | 5.6% | 9.4% | +3.8% |
| Ronald Jones | RB | $6,000 | $5,800 | 9.2% | 13.1% | +3.9% |
| Robby Anderson | WR | $6,300 | $6,500 | 6.1% | 10.2% | +4.1% |
| Deshaun Watson | QB | $7,000 | $8,200 | 5.1% | 9.4% | +4.3% |
| James Conner | RB | $7,100 | $7,100 | 3.3% | 7.7% | +4.4% |
| Kenny Golladay | WR | $6,200 | $7,200 | 24.7% | 29.2% | +4.5% |
| Kareem Hunt | RB | $6,900 | $7,000 | 6.1% | 10.7% | +4.6% |
| Marquise Brown | WR | $6,500 | $6,300 | 4.7% | 9.3% | +4.6% |
| Patriots | DST | $4,100 | $4,800 | 7.5% | 12.9% | +5.4% |
| Davante Adams | WR | $8,000 | $9,000 | 17.3% | 22.8% | +5.5% |
| Derrick Henry | RB | $7,300 | $9,000 | 26.1% | 31.9% | +5.8% |
| Colts | DST | $4,000 | $5,000 | 8.3% | 14.3% | +6.0% |
| Calvin Ridley | WR | $7,800 | $8,600 | 13.2% | 19.3% | +6.2% |
| Mike Gesicki | TE | $5,500 | $5,600 | 4.7% | 11.3% | +6.6% |
| Will Fuller | WR | $6,800 | $6,700 | 7.2% | 14.0% | +6.8% |
| Allen Robinson | WR | $7,000 | $7,000 | 5.8% | 12.9% | +7.1% |
| Jonathan Taylor | RB | $6,400 | $7,300 | 12.1% | 19.9% | +7.8% |
| Mark Andrews | TE | $6,500 | $7,600 | 9.8% | 19.1% | +9.3% |
| James Robinson | RB | $6,800 | $6,500 | 17.3% | 27.7% | +10.4% |
| Adam Thielen | WR | $7,300 | $7,400 | 27.1% | 38.0% | +10.9% |
| Ravens | DST | $4,500 | $4,900 | 4.0% | 15.0% | +11.0% |
| Jonnu Smith | TE | $5,200 | $5,800 | 14.8% | 26.0% | +11.2% |
| Mike Davis | RB | $7,000 | $7,500 | 18.7% | 32.0% | +13.3% |
| Alexander Mattison | RB | $7,200 | $7,000 | 23.0% | 43.2% | +20.2% |
Returning to the example of Trey Burton, we see that because salaries are not tight on FanDuel, players aren’t forced to completely punt positions like tight end and defense like they are on DraftKings, where positions like tight end and defense have an especially low salary floor. With that, the more expensive players are naturally going to draw higher ownership on FanDuel than on Draftkings.
This concept can and should have a major impact on how tournament lineups are being built on each site. A player like Burton is a great tournament play when he isn’t expected to be popular, but is often one to avoid when his expected ownership is in the double digits. Other than upside, the main consideration when building a GPP lineup should be average projected ownership. Knowing how sites might differ because of salary structures can help make more optimal decisions.