TJ's #Taek: Week 3 NFL DFS GPP Recap

Week 3’s winning lineups from the biggest contests on FanDuel and DraftKings can be used to tease out lineup-building strategies and offer clues on how you could have landed on a similar team. Reviewing your hits and misses each week is imperative if you want to be a profitable DFS player but examining winning lineups is also a useful exercise in cultivating a winning approach.
More GPP Strategy: QB | RB | WR | TE | DEF
DraftKings Week 3 Millionaire Winning Lineup
Most Rostered Players
| Player | Pos | Salary | Ownership |
|---|---|---|---|
| Daniel Jones | QB | 5800 | 11.1% |
| Kyler Murray | QB | 8300 | 10.7% |
| Russell Wilson | QB | 7600 | 8.4% |
| Justin Herbert | QB | 6500 | 8.2% |
| Matthew Stafford | QB | 6400 | 7.9% |
| Austin Ekeler | RB | 7200 | 20.6% |
| Saquon Barkley | RB | 6500 | 20.1% |
| Clyde Edwards-Helaire | RB | 4800 | 16.1% |
| Alexander Mattison | RB | 6000 | 14.8% |
| Derrick Henry | RB | 8600 | 14.2% |
| Cooper Kupp | WR | 6800 | 33.1% |
| Chris Godwin | WR | 6100 | 17.4% |
| Tyler Lockett | WR | 7400 | 15.4% |
| Marvin Jones | WR | 4900 | 15.4% |
| K.J. Osborn | WR | 3500 | 14.8% |
| T.J. Hockenson | TE | 5200 | 29.0% |
| Kyle Pitts | TE | 4900 | 12.8% |
| Rob Gronkowski | TE | 5500 | 11.5% |
| Travis Kelce | TE | 8200 | 9.0% |
| Darren Waller | TE | 7400 | 8.0% |
| Cardinals | DEF | 3000 | 16.8% |
| Bengals | DEF | 2100 | 14.7% |
| Titans | DEF | 2400 | 13.9% |
| Raiders | DEF | 3400 | 9.9% |
| Broncos | DEF | 4300 | 7.6% |
As was the case in Week 2, we saw low average ownership among Millionaire lineups in Week 3—just two players ended up on over 20% of rosters with only 25 players carrying a double-digit rostered rate.
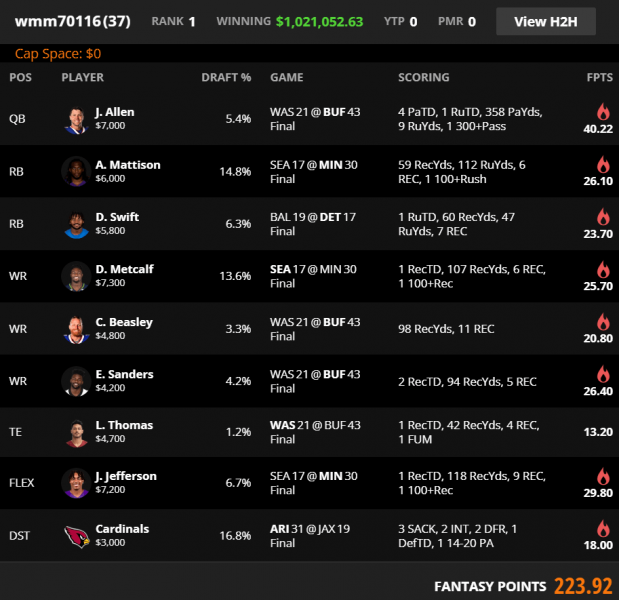
A flat ownership trend combined with multiple teams carrying high implied point totals led to some quarterbacks being on fewer rosters than expected. Josh Allen was in the winning lineup and on just over 5% of rosters despite the Bills having a point projection near 28 and Allen with a salary well below some of the other top passers.
Facing a Washington defense that had struggled against Justin Herbert and Daniel Jones in the first two weeks, stacking Allen and two of his pass-catchers proved to be especially unique, even in a week with low rostered rates across the board. Bringing it back with tight end Logan Thomas rounded out a game stack that leveraged against some of the most popular games on the slate.
That primary stack combined with three players from the Vikings/Seahawks game made it two weeks in a row that the Milly winner used seven players with some correlation to another player in the lineup. Implementing the trend of combining game stacks with mini-correlations helped separate from the field in a week where it was already easy to be unique via player selection—as more players are added to a game stack, the less likely it is that other entries will have that exact combination of exposure to said game.
Week 1’s review discussed the idea of targeting situations that not only offer leverage but offer the most leverage. D’Andre Swift was a great example in Week 3—his teammate T.J. Hockenson was the second-most rostered player on the slate, he was playing opposite an offense with multiple players with relatively high ownership projections, a good game from him likely meant a flip in expected game script, and he was a natural salary pivot off of running backs such as Ty’Son Williams and Alexander Mattison.
FanDuel Week 3 Sunday Million Winning Lineup
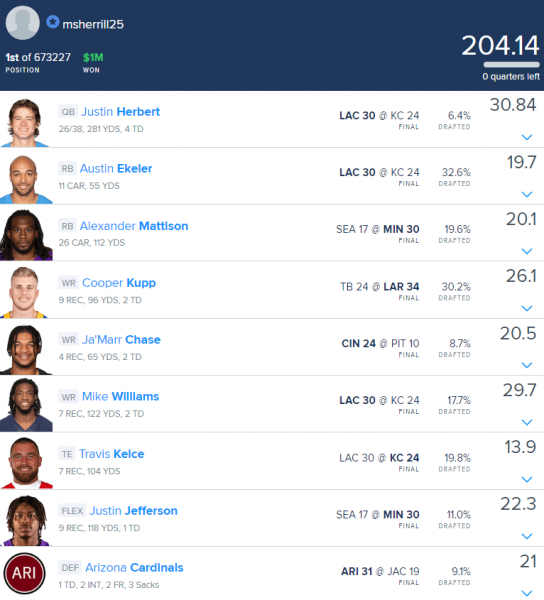
Contrary to DraftKings, FanDuel’s Sunday Million winner used a lineup full of relatively popular players, ending up with average ownership above 17%. The loose salary structure on FanDuel allows ownership to concentrate heavily on mid-to-high-salary players—once the Alexander Mattison free square opened up, it was natural for multiple players to approach or exceed a 30% rostered rate.
It’s not typical that a lineup full of this many popular plays is able to separate itself from the field in such a large tournament as only two Sunday Million winners in 2020 carried a higher ownership average.
Where msherrill25 was able to get unique was through heavy correlation, using four players from Chiefs/Chargers along with two Vikings teammates. As mentioned earlier, heavily stacking just a couple of situations decreases the likelihood of overlap in team or game exposures with other players in the same contest.
Although Justin Herbert ended up with a lower ownership rate than Ja’Marr Chase, Chase was the most unique player in the lineup relative to other players at his position. With Tee Higgins out, it was likely that the Bengals’ targets would be heavily concentrated between Chase and Tyler Boyd. While they only combined for 11 targets, that made up over half of Cincinnati’s targets Sunday. Chase’s early-season weighted opportunity suggested that he has hidden upside even when his volume is relatively low.

TJs Final #Taek
One of the biggest surprises of Week 3 was how ownership percentage played out, particularly at the quarterback position—Lamar Jackson, Patrick Mahomes, and Josh Allen were all in 6% or less of Millionaire lineups. When there is flat ownership and a low ownership ceiling, ownership gets more condensed than usual—this means that we should expect to see more surprises in ownership, at least in relative terms.
In weeks such as Week 2 and Week 3, when there aren’t huge gaps in ownership projections, we should treat ownership projections with similar fragility that we treat point projections. The “onesie” positions are especially fragile in relation to ownership. Returning to this week’s quarterback example, Josh Allen was projected to be among the top three most popular quarterbacks but 11 quarterbacks had a projection within a 5% range. Allen ended up as the ninth most popular quarterback.
How do we put this perceived fragility into action?
Allen wasn’t among my most-used tournament quarterbacks because I erroneously put too much weight on his ownership projection, failing to account for the fragility of that projection with so many players at his position packed so tightly together. Considering the possibility that he could slip in ownership might have led me to roster him more and likely have a more profitable week.
These scenarios are why we project ownership in ranges—rather than in absolutes—at 4for4 and why DFS players should care less about the absolute projection and more about that projection relative to other players, especially at the same position. When we have less confidence about who the most popular players will be, we should be more willing to roster our favorite players even when they project as “chalky”.


