NFL DFS Playbook: Quarterback Strategy Guide

DFS is a game of predictions, both in trying to accurately project player outcomes while also anticipating what your opponents will do. This series will focus on both aspects, explaining where fantasy points come from and how past performance helps predict those outcomes as well as exploring how winning players have built profitable lineups.
Part one of the series will examine the quarterback position, exploring topics such as how many past games we should use to look forward, what betting lines suggest about quarterback performance, how predictive DFS salaries are, and how to approach the position in large-field GPPs.
DFS Playbook 2021: RB | WR | TE | DEF
How to Predict Fantasy Scoring for Quarterbacks
Use Relevant Sample Sizes
Listen to or read any fantasy analysis and you will almost certainly hear a stat referenced within some time frame such as “this season”, “last game”, or any arbitrary timeline in between that might help support the point the analyst is trying to make. There are instances when specific time spans should be used, such as when a backup has suddenly supplanted a starter, but too often these citations are subjective—in the worst scenarios, a fantasy analyst might be quoting data that is nothing more than noise with no predictive value.
To combat this issue, we looked to the stat that we care about the most—fantasy points—for every quarterback game over the last three seasons and the relationship between a quarterback’s performance in one game to his per-game average for every possible sample size (1 game to 15 games).
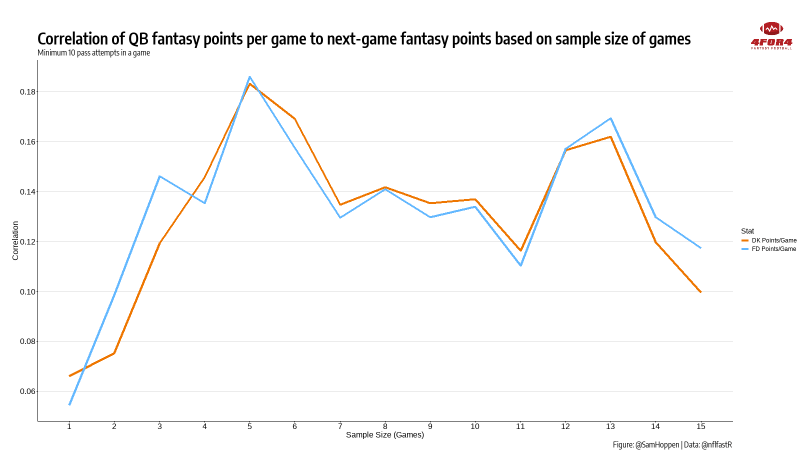
What this image shows us is that when referencing fantasy points scored, the most relevant and predictive sample size for quarterbacks is five games, while a one-game sample has almost zero correlation to next week’s fantasy output. It’s an especially important note for quarterbacks that as the sample size goes beyond five games, past performance becomes slightly less predictive. As we’ll see as this series continues, we typically want as big of a sample size as possible for other positions.
When doing your research or getting advice from your favorite resource, be cognizant of arbitrary sample sizes, and when in doubt, use the last five weeks for quarterback scoring.
Which Quarterback Stats are the Most Predictable?
We know that quarterback rushing is extremely valuable but not all quarterbacks run often, making it nearly impossible to do a league-wide apples-to-apples comparison on rushing numbers for the position. What matters is that we should be targeting mobile passers in fantasy, especially after what we saw in 2020.
All quarterbacks, however, do throw quite a bit every game so we can do a league-wide study on which passing stats we should be emphasizing for single-week projections.
Each offseason, I write a series that highlights the stickiest year-to-year stats for every position. For quarterbacks, passing and rushing volume tend to hold steady from one year to the next while efficiency metrics such as touchdown rate can have wild fluctuations between seasons.
Given the relevance of the five-game sample shown in the previous section, we ran a correlation of quarterback fantasy points on FanDuel and DraftKings to the most important volume and efficiency passing statistics using a running five-game historical average for all quarterbacks with at least five attempts in a game.
| Stat | Correlation to DK Points | Correlation to FD Points |
|---|---|---|
| Touchdown Rate | 0.18 | 0.18 |
| Yards/Attempt | 0.14 | 0.14 |
| Passing Yards | 0.12 | 0.12 |
| Completion % | 0.10 | 0.10 |
| Pass Attempts | 0.04 | 0.02 |
| Interception Rate | -0.06 | -0.06 |
Table: @SamHoppen| Data: @nflfastR
The biggest takeaway here is that volume had virtually no correlation to the next game’s fantasy output while efficiency numbers—touchdown rate and yards per attempt—over the last five weeks best predicted how a quarterback would perform in his upcoming contest.
One common narrative that this data dispels is the notion that a quarterback who will likely be trailing carries added value since he might be forced to throw more than usual. The quarterbacks in the best conditions typically need fewer pass attempts to be valuable by definition of touchdown rate—the fewer passes that you can score on, the higher the scoring rate.
Equipped with the knowledge that efficiency trumps volume when targeting quarterbacks in DFS, we can separate ourselves from the field by identifying optimal circumstances for our passers through the use of betting lines.
Using Betting Lines for Quarterback Projections
So far we’ve shown which stats are most reliable when projecting a quarterback for one week and how far we should go back to look at data but the correlation numbers for both data sets have been quite weak in relation to fantasy scoring. One piece of information available before kickoff with a notable relationship to a quarterback’s fantasy output is a team’s betting odds, specifically their implied point total.
| Betting Odds | Correlation to DK Points | Correlation to FD Points |
|---|---|---|
| Implied Team Total | 0.33 | 0.33 |
| Over/Under | 0.26 | 0.25 |
| Spread | -0.22 | -0.23 |
Table: @SamHoppen| Data: @nflfastR
Other than 4for4’s weekly projections—which have a 0.41 correlation to quarterback fantasy points over the last two seasons—no single number is more predictive of a quarterback’s fantasy points in a given week than his team’s implied point total.
It can be tempting to browse over/unders and try to pinpoint shootouts when looking for quarterbacks in DFS but that practice alone could result in overlooking teams that are in a position to score a lot of points even though the game may not be a high-scoring, back-and-forth affair on both sides.
Salary-Based Point Expectation
DFS salaries have progressively gotten sharper over the years, seemingly taking into account all of the factors mentioned above. As a predictive measure for fantasy points, a quarterback’s salary has been about as successful as a team’s implied point total—on both FanDuel and DraftKings, quarterback salary has had a correlation of 0.36 to fantasy points.
This alone doesn’t tell us much since we’re often choosing between quarterbacks with the same or similar salaries but when we look at how many points quarterbacks have historically scored in relation to their salary, we do get some insight.
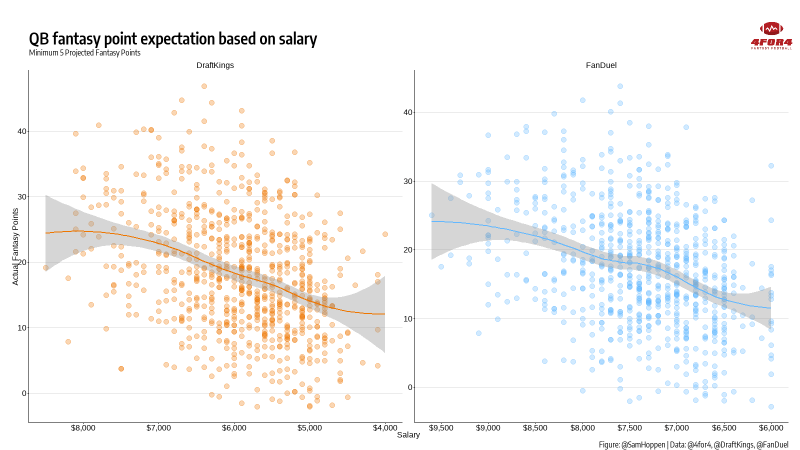
Every week in DFS is so different that it can be dangerous to have hard rules about how much to spend at each position. Contest data from last season on DraftKings, for example, shows that optimal lineups had an average quarterback salary of about $6,900 but the range of quarterback salaries in those optimal lineups was as low as $4,800 and as high as $8,500.
What we can see from the salary-based point model above is that it’s usually wise to stay away from the salary extremes. On DraftKings, for example, the expected points for a quarterback priced at the bottom of the $7,000 range is almost the same as one priced closer to $8,000. On FanDuel, the few quarterbacks that reach the $9,000 mark only score marginally more than those priced around $8,500 and we see the point curve flatten out a lot between the $7,000 and $8,000 range.
Quarterbacks priced near the minimum rarely score enough points to come close to high-end quarterbacks, especially with the ascent of the efficient, dual-threat quarterbacks that we have seen in recent years. Even if a $5,000 quarterback can hit some arbitrary value multiplier like 2.5x or 3x, that still leaves DFS players at a disadvantage when multiple quarterbacks have 30+-point upside every week.
Rather than try to memorize this expected points graph, though, 4for4 subscribers simply have to know that this model gets us away from a linear value model such as projected points per dollar. This non-linear model powers our proprietary value metric that helps properly value players across all positions.
Equipped with the above knowledge for the most likely quarterback outcomes, cash game players can consider all of these factors to find quarterbacks with the most optimal conditions and adjust their salary approach based on the factors in play for a given week.
In tournaments, however, simply targeting the most likely outcome won’t get the job done.
How to Pick Quarterbacks in DFS GPPs
Playing DFS tournaments requires a contrarian mindset but that doesn’t mean throwing caution to the wind and making a lineup full of players that are in fewer than 10% of lineups. Even in the largest-field tournaments, DFS players only have to be super unique at a couple of roster spots—often one of those spots is quarterback.
Using data from the DraftKings Millionaire and the FanDuel Sunday Million over the last two seasons, we can see how the best lineups approached the quarterback position in terms of both ownership percentages and salary.
Quarterback Ownership Percentages
Since DFS rosters only require one quarterback, ownership at the position has a lower ceiling than the other positions, especially running backs and wide receivers—it’s rare to see any quarterback in over 20% of lineups. Even with this caveat, though, the most popular quarterbacks on the slate rarely make the best tournament plays, especially on DraftKings where tight salaries make it tough to pay for the best game conditions all the time.
In 2020, just four Millionaire winners used a quarterback with an ownership percentage of 15% or more and in 2019 there was only one such winner. The FanDuel Sunday Million has had seven total winners with quarterbacks carrying ownership of at least 15% since the beginning of 2019.
On the flip side, a third of Millionaire winners over the last two seasons have used a quarterback with sub-5% ownership and nine Sunday Million winners have used a sub-5% signal-caller.
Over the last two seasons, only the WR3 and Flex positions carried a lower average ownership number than quarterbacks for both Millionaire and Sunday Million winners.
| Week | DraftKings 2019 | DraftKings 2020 | FanDuel 2019 | FanDuel 2020 |
|---|---|---|---|---|
| 1 | 6.9 | 2.6 | 10.0 | 2.9 |
| 2 | 13.2 | 11.2 | 14.3 | 11.0 |
| 3 | 6.6 | 15.8 | 2.9 | 18.0 |
| 4 | 4.0 | 8.7 | 5.3 | 12.8 |
| 5 | 2.7 | 13.5 | 16.9 | 10.2 |
| 6 | 19.2 | 4.2 | 11.5 | 3.7 |
| 7 | 2.2 | 6.3 | 2.9 | 15.0 |
| 8 | 1.6 | 8.7 | 2.0 | 12.9 |
| 9 | 13.2 | 7.0 | 15.8 | 0.7 |
| 10 | 12.7 | 18.6 | 15.3 | 9.7 |
| 11 | 3.8 | 17.7 | 7.4 | 18.0 |
| 12 | 14.6 | 1.2 | 13.7 | 17.7 |
| 13 | 7.6 | 4.9 | 4.4 | 7.3 |
| 14 | 2.1 | 0.8 | 1.2 | 0.9 |
| 15 | 6.1 | 11.1 | 5.7 | 10.7 |
| 16 | - | 7.9 | 2.4 | 10.1 |
| 17 | 9.0 | 15.2 | 8.3 | 6.1 |
| Average | 7.8 | 9.1 | 8.2 | 9.9 |
How Much GPP Winners Spend on Quarterbacks
It often pays to be contrarian at quarterback in tournaments but that doesn’t necessarily mean spending down for a cheap quarterback in suboptimal conditions. Recall from earlier that salaries typically account for things such as matchups, implied totals and a player’s recent performance—since quarterback scoring is typically quite predictable, it makes sense that the lowest-priced quarterbacks rarely put up numbers good enough to take down a GPP.
In fact, with the rise of the dual-threat, efficient quarterback, quarterback salaries were driven up last season and relatively expensive quarterbacks ended up in winning lineups more often than in years past, especially on FanDuel where rostering multiple high-priced studs is typically quite feasible.
Tournament players don’t always have to look at the very top of the pricing list for their quarterback but the mid-to-high range is usually the sweet spot. Since 2019, the average Millionaire winner has allocated about $6,500 to quarterback, the third-highest average salary of the nine roster spots. In Sunday Millions, winners have typically spent more on quarterback than any position except their RB1.
As is always the case, how much to spend on a position is week-specific, but the top fantasy quarterbacks in the game right now have a ceiling that can rarely be matched by low-salary options.
| Week | DraftKings 2019 | DraftKings 2020 | FanDuel 2019 | FanDuel 2020 |
|---|---|---|---|---|
| 1 | $6,000 | $6,300 | $7,400 | $7,500 |
| 2 | $7,500 | $6,800 | $9,000 | $8,300 |
| 3 | $5,400 | $7,300 | $6,000 | $8,700 |
| 4 | $6,300 | $7,200 | $7,700 | $8,200 |
| 5 | $5,200 | $7,700 | $8,000 | $8,300 |
| 6 | $6,400 | $6,600 | $7,700 | $7,400 |
| 7 | $6,400 | $8,000 | $7,600 | $8,400 |
| 8 | $5,800 | $8,100 | $6,900 | $8,400 |
| 9 | $7,100 | $5,200 | $8,600 | $7,300 |
| 10 | $7,000 | $8,000 | $8,600 | $8,700 |
| 11 | $6,600 | $4,800 | $7,800 | $8,500 |
| 12 | $5,900 | $5,300 | $7,500 | $9,000 |
| 13 | $5,800 | $5,800 | $7,900 | $8,200 |
| 14 | $5,600 | $6,000 | $7,700 | $6,600 |
| 15 | $6,900 | $5,900 | $8,200 | $6,900 |
| 16 | - | $7,600 | $7,100 | $8,500 |
| 17 | $6,300 | $6,300 | $8,000 | $8,400 |
| Average | $6,263 | $6,641 | $7,747 | $8,076 |
Stacking to Maximize Upside
An argument can be made that the best NFL DFS tournament players are targeting games and situations more so than specific players. Of course, we want quarterbacks in high-scoring shootouts but most of the time, the quarterbacks on teams with the highest implied totals are the ones with the highest ownership percentages.
To combat this, many profitable DFS players have rostered quarterbacks in the second or third tier of implied points or played the quarterbacks who are facing the most popular quarterbacks of the week. With either strategy, one constant is that quarterbacks are stacked with teammates as well as players on the other team.
Last season, 16 of 17 DraftKings Millionaire winners used a quarterback stack, and 13 of those 16 used at least three players from the same game. Additionally, 10 of those teams used a smaller secondary stack such RB-DEF and three winners went as far as stacking three different games. On average, Millionaire winners used about five correlated players per week.
FanDuel Sunday Million winners stacked even more aggressively, averaging nearly six correlated players per winning lineup.

The Bottom Line
- When using past quarterback fantasy scoring to predict the next game, five games is the optimal sample size for most situations.
- For in-season statistics, efficiency metrics trump volume numbers. Touchdown rate and yards per attempt are most likely to continue for quarterbacks based on recent performance.
- Using betting lines is among the most efficient way to predict how a quarterback will perform in fantasy. Implied point totals—which account for the spread and over/under—correlated more to quarterback fantasy points than any available stat besides 4for4 projections.
- Salary can be used as an expected points model but just because there is a strong correlation between salary and scoring doesn’t mean that DFS players should automatically pay all the way up for a quarterback. Oftentimes, the players at the lower end of a salary tier will match the scoring of players at the high end of the same tier. A non-linear expected points model allows 4for4 subscribers to see value across positions in an apples-to-apples manner.
- In GPPs, quarterback ownership is generally quite flat but winning lineups have had more success when rostering low-owned quarterbacks than chalky ones.
- While it has paid to be contrarian at quarterback, tournament winners have typically spent a decent amount of salary at the position, especially in 2020. With dual-threat quarterbacks also being some of the most efficient passers in the game today, it’s tough for low-salary quarterbacks to match the upside of the top players at the position. It’s especially hard to win tournaments while paying down on FanDuel, where rostering multiple studs is usually relatively easy.
- Good tournament players are targeting game situations as much as they are individual players, leading to heavy stacks, not just with their quarterback but across multiple games. Most tournament winners stack their quarterback with multiple players from both teams in that game.
Thank you to Sam Hoopen for compiling the data used in this article. Follow Sam on Twitter @SamHoppen.


