NFL DFS Playbook: Tight End Strategy Guide

The DFS Playbook is designed to help fantasy players understand where fantasy points come from and how past performance can help predict future outcomes. This is done by exploring which stats correlate to future fantasy production, understanding relevant sample sizes, learning how to correctly use betting lines, and analyzing how to navigate DFS salaries by position. Building this foundation will allow DFS players to master the basics of cash games before examining how to build winning tournament lineups. For the fourth iteration in this series, we will examine the tight end position.
DFS Playbook 2021: QB | RB | WR | DEF
How to Predict Fantasy Scoring for Tight Ends
Use Relevant Sample Sizes
In the wide receiver chapter of The Playbook, we found out that we wanted as many games as possible when using in-season fantasy point averages to predict next-game fantasy production. The reasoning is that wide receivers don’t see much volume relative to other positions, leading to high variance, touchdown-dependent scores. That line of logic should follow for tight ends but the data paints a different picture.
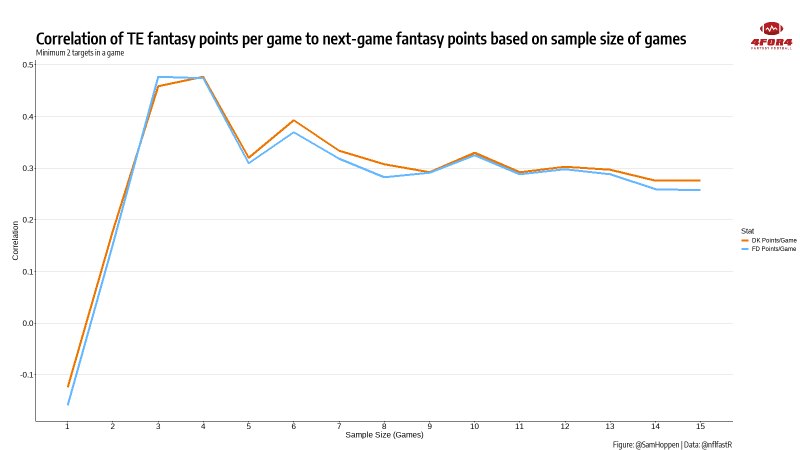
If we only focus on volume, it wouldn’t make sense that tight ends—who as a group see less volume than receivers—would have fantasy scoring that not only stabilizes faster but is more predictable with fewer games than wide receivers. The difference is that tight end scoring is concentrated among far fewer players than it is with receivers. Take 2020 as an example. In half-PPR scoring, there were 158 instances of a tight end scoring 10 or more points but 15 tight ends accounted for almost two-thirds of those games, with seven tight ends making up almost 40% of 10-point games.
With receivers who had the most games of 10+ points, we need almost 50 players to account for two-thirds of their games with at least 10 points.
Since just a handful of tight ends make up most of the scoring, fantasy points stabilize relatively fast across the position.
When referencing fantasy points scored, the most relevant sample size for predicting next-game performance for tight ends is three games. The correlation is stable enough beyond three games, though, that we can safely say that when referencing average tight end fantasy points in terms of potential in-season future production, to use a sample of three games or more—samples of fewer than three games are likely just noise.
Which Tight End Stats are the Most Predictable
If you’ve read this series in order, it’s probably clear by now that for non-quarterbacks, we should be chasing volume. When we consider how next-game fantasy points on both FanDuel and DraftKings correlate to various tight end stats using a three-game historical average, the sentiment remains.
| Stat | Correlation to DK Points | Correlation to FD Points |
|---|---|---|
| Targets Share | 0.35 | 0.33 |
| Targets | 0.34 | 0.32 |
| Receiving Yards | 0.33 | 0.30 |
| Receptions | 0.33 | 0.30 |
| Air Yards Share | 0.32 | 0.31 |
| Average Depth of Target | 0.09 | 0.10 |
| Yards per Target | 0.04 | 0.02 |
Table: @SamHoppen| Data: @nflfastR
One thing to note about tight ends is how close the correlation of targets to next-game scoring and the correlation of fantasy points to next-game scoring is. While targets are more reliable than fantasy points over an entire season for tight ends, we still see a very big peak at three and four games for tight end fantasy points.
Unlike wide receivers—where past fantasy scoring comes second to volume when making projections—we can weight volume and fantasy scoring quite evenly when researching tight ends for next-game scoring.
Like we also pointed out with receivers, it’s worth it to always keep tabs on target share for tight ends. This helps in case a player’s team might be in for a bump in passing rate. If that happens, high target share tight ends can suddenly become under-the-radar buys.
The example used in the wide receiver article touched on big underdogs who might benefit from garbage time, especially on DraftKings. While we typically don’t think of tight ends as garbage time beneficiaries, the top tight ends now have target shares comparable to top receivers, making them candidates to roster in these scenarios.
Using Betting Lines for Tight End Projections
One area that is typically useful when researching DFS but somewhat ambiguous when it comes to tight ends is betting lines. We know that spreads and implied totals can have strong predictive value for quarterbacks and running backs, while there are exploitable edges at wide receiver, especially with certain home/road splits. At the macro-level, though, it’s tough to find a relationship between tight end scoring and betting lines—most tight ends see so few targets that it’s rare for game flow to shift their production one way or another.
| Betting Odds | Correlation to DK Points | Correlation to FD Points |
|---|---|---|
| Implied Team Total | 0.15 | 0.15 |
| Over/Under | 0.12 | 0.12 |
| Spread | -0.10 | -0.10 |
Table: @SamHoppen| Data: @nflfastR
As mentioned earlier, there is a relatively small group of tight ends accounting for most of the tight end scoring so analyzing betting odds against the position as a whole doesn’t tell the entire story. To get a better idea of where fantasy points come from in relation to betting odds, I focused on the highest-scoring tight end games and compared them to home and away splits, point spreads, and implied team totals.
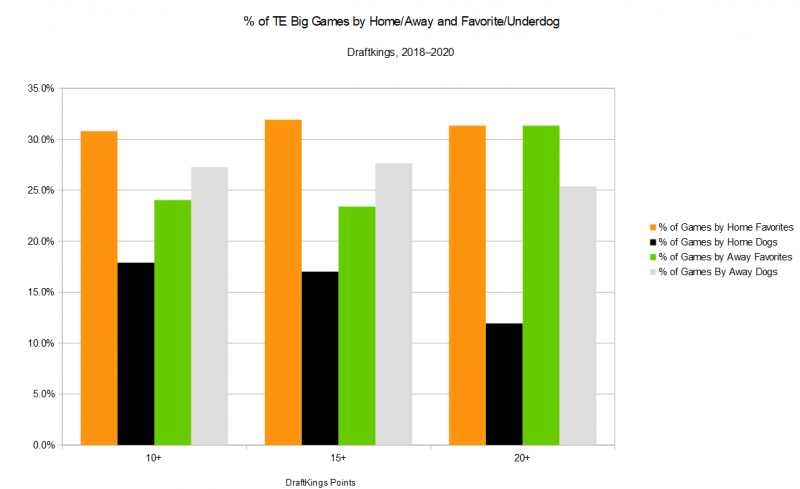
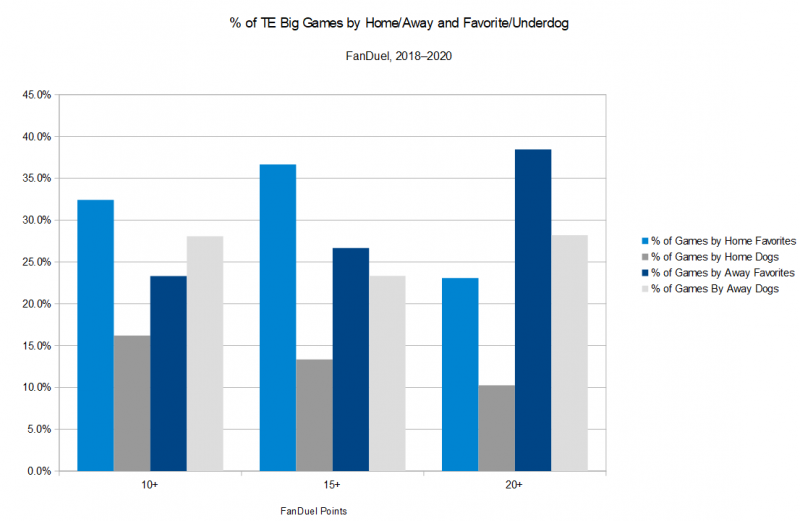
Being a home favorite is beneficial for offensive scoring and we’ve seen across the board that the most likely scenario for any position to have a big game is when they are favored at home—the worst scenario is being a home underdog. This doesn’t match public sentiment as there is often extra weight added to home-field advantage even if a team is an underdog—this bias may even show up in betting odds.
A theory as to why away underdogs are scoring more points—and in turn, more fantasy points—than home dogs is that games are higher scoring when the home team is favored. A full explanation of this phenomenon can be found in the Wide Receiver Strategy Guide but the takeaway is this: we can fade players in popular games when the home team is an underdog or we can heavily target unpopular road dogs and home favorites, especially in tournaments.
There has been a positive relationship between a team’s implied point total and the likelihood of a big fantasy game from their tight end. Using last season as an example, teams with an implied total under 21 produced a tight end with 15+ DraftKings points about 8% of the time. Implied totals between 21 and 27.75 saw that kind of tight end scoring in about 15% of contests and the rate spiked to 22% when the team total was 28 or higher. Rates increased similarly on FanDuel for all fantasy point thresholds above 10.
Ownership will often have a positive correlation with a team’s implied point total in DFS tournaments but cash game players can add implied totals to their tight end selection process.
Salary-Based Point Expectation
Similar to wide receiver, tight end fantasy scoring has a relatively strong relationship to salary when looking at all players at the position—the correlation is about 0.49 on both sites—but plummets to about 0.34 when we tease out fantasy-relevant players (projected for 5+ DK points or 4+ FD points).
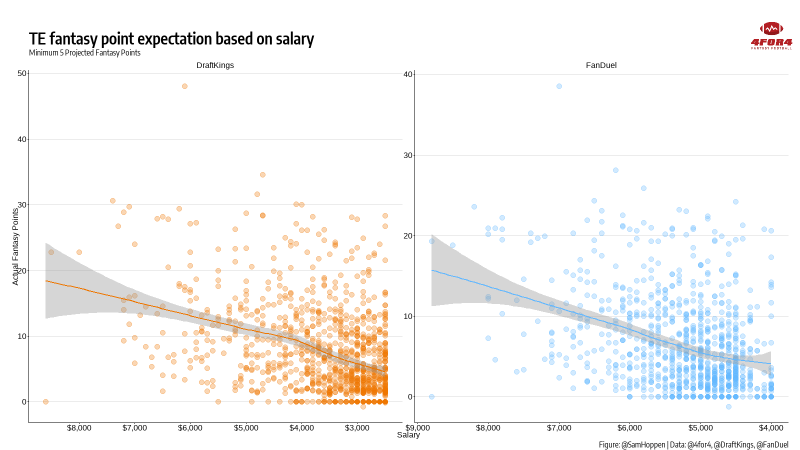
The somewhat flat trend line shows us that lower-salary salary tight ends regularly score as much or more than higher-salary tight ends. We know from earlier sections in this chapter that tight end scoring stabilizes and becomes relatively predictable with a somewhat small sample of games—this suggests that DFS sites are slow to adjust salaries to consistent tight end production, bad at pricing the position, or both. (Recall from the running back guide that proper salary adjustment shows a sharp downward trend.)
If only a handful of tight ends score most of the points but salaries aren’t super efficient, then we should almost never be “middling” the position. The top three or four tight-end options are usually priced well above the field but usually produce as such—after that, players with salaries closer to the minimum often match or outproduce players with salaries in the middle tier. At least in cash games, it’s usually best to pay all the way up (especially on FanDuel where you can roster more studs) or as far down as possible at tight end.
This expected points model powers 4for4’s proprietary value metric that compares positions on an even playing field and often supports the notion of spending at the extremes for tight end.
How to Pick Tight Ends in DFS GPPs
Winning an NFL DFS tournament requires you to be contrarian but that doesn’t mean playing a bunch of players just because no one else is. Tight end is a fascinating position because there is only one required roster spot but a plethora of strategies that have been successful in GPPs.
Using data from the DraftKings Millionaire and the FanDuel Sunday Million over the last two seasons, we can see how the best lineups approached the tight end position in terms of both ownership percentages and salary.
Tight End Ownership Percentages
With rosters requiring only one tight end, ownership is generally quite flat at the position, meaning that even if you opt for the most popular player at the position, the overall ownership of your lineup isn’t going to skyrocket—in other words, it’s pretty easy to have a very unique lineup even with one of the most popular tight ends on the slate.
On the flip side, this also makes it pretty easy to be contrarian at the position—mathematically, only a few tight ends can have ownership approaching or exceeding 20%, so there are going to be way more sub-10% plays than not.
With no clear trend on what works and what doesn’t in terms of ownership, a good rule of thumb is that if you are going to eat the chalk, do so with a premium tight in optimal conditions—at a low-volume position like tight end, it makes little sense to follow the crowd in hopes of an unproven player hitting tournament-winning upside just because he is cheap.
This rule works especially well on FanDuel, where rostering a stud tight end doesn’t grossly inhibit paying up elsewhere. Over the last two seasons, when Sunday Million winners used a tight end with ownership of at least 10%, that player's average salary was about $7,100. Tight ends on winning lineups with sub-10% ownership had an average salary of about $5,700. (This excludes the week when Taysom Hill played quarterback but had tight end designation.)
| Week | DraftKings 2019 | DraftKings 2020 | FanDuel 2019 | FanDuel 2020 |
|---|---|---|---|---|
| 1 | 13.2 | 3.4 | 3.4 | 0.6 |
| 2 | 16.6 | 11.9 | 19.7 | 3.2 |
| 3 | 5.9 | 1.7 | 13.2 | 0.9 |
| 4 | 27.0 | 17.1 | 23.7 | 9.1 |
| 5 | 3.6 | 12.0 | 15.4 | 12.0 |
| 6 | 37.3 | 1.4 | 30.8 | 2.8 |
| 7 | 2.8 | 2.8 | 7.3 | 2.2 |
| 8 | 10.9 | 9.7 | 9.6 | 5.9 |
| 9 | 3.4 | 6.0 | 8.8 | 2.8 |
| 10 | 10.6 | 3.5 | 7.8 | 3.4 |
| 11 | 3.8 | 12.1 | 5.5 | 68.1* |
| 12 | 3.1 | 12.0 | 32.4 | 1.4 |
| 13 | 11.8 | 21.0 | 6.7 | 16.0 |
| 14 | 2.0 | 9.2 | 10.4 | 6.4 |
| 15 | 34.7 | 5.6 | 20.9 | 20.3 |
| 16 | - | 6.3 | 4.1 | 35.8 |
| 17 | 14.8 | 13.4 | 32.1 | 7.1 |
| Average | 12.6 | 8.8 | 14.8 | 11.6 |
*Note that the 68% owned tight end on FanDuel was when Taysom Hill retained his TE designation despite being named the Saints starting quarterback. Without this data point, the average FanDuel ownership for tight ends in 2020 drops to 8.1%.
How Much GPP Winners Spend on Tight Ends
Tight end stands out as the most site-dependent when it comes to how GPP players allocate their salary to a position. DraftKings typically has tighter salaries than FanDuel, making it harder to pay up at a “onesie” position like tight end on DK, especially with how much of a premium is now placed on top-end quarterbacks.
With that, Millionaire winners have typically only spent less on their defense and flex player than they have at tight end. On FanDuel, where it’s easier to jam in multiple studs, Sunday Million winners have spent almost as much at tight end as they have on their RB2 or WR2. The 2020 numbers on FanDuel showed more of a balanced strategy with six winners paying $7,000 or more at tight end and six paying less than $5,500. In 2019, however, the trend was to roster players at the higher end of the middle tier, with just one winner paying over $6,800 at tight end and three using less than $5,500 of salary.
While paying down is the slightly more favorable strategy on DraftKings, FanDuel allows for users to comfortably pay up at the position. As the suggested rule in the ownership section points out, when winners did pay up, it was usually for a top-end player in premium conditions, in spite of his high ownership.
| Week | DraftKings 2019 | DraftKings 2020 | FanDuel 2019 | FanDuel 2020 |
|---|---|---|---|---|
| 1 | $4,800 | $4,000 | $5,400 | $4,000 |
| 2 | $7,300 | $7,000 | $8,000 | $5,800 |
| 3 | $4,100 | $4,400 | $6,400 | $5,100 |
| 4 | $3,600 | $5,200 | $6,800 | $7,400 |
| 5 | $3,400 | $6,400 | $6,600 | $7,800 |
| 6 | $5,000 | $4,700 | $6,400 | $4,700 |
| 7 | $4,200 | $2,500 | $6,200 | $5,100 |
| 8 | $5,300 | $6,600 | $6,700 | $5,900 |
| 9 | $3,000 | $3,900 | $6,000 | $5,700 |
| 10 | $5,500 | $3,300 | $5,000 | $5,500 |
| 11 | $2,900 | $3,800 | $6,200 | $4,500 |
| 12 | $4,500 | $2,800 | $6,100 | $5,400 |
| 13 | $7,200 | $6,100 | $5,500 | $7,000 |
| 14 | $6,000 | $4,500 | $6,700 | $5,700 |
| 15 | $3,900 | $4,000 | $6,700 | $8,500 |
| 16 | - | $5,700 | $5,300 | $8,800 |
| 17 | $5,600 | $4,200 | $6,400 | $7,800 |
| Average | $4,769 | $4,653 | $6,259 | $6,159 |
A note on using a tight end in the flex – Across the 67 Millionaire and Sunday Millions played over the past two seasons, just three winners have used a tight end in the flex. The strategies have been mixed with two cheap contrarian options, two high-priced studs, and one stud with one scrub. The constant with these three teams is that the tight ends have been stacked, either with each other or somewhere else in the lineup. Two tight ends should be used sporadically but if it will make a chalky game stack unique or complete a stack that offsets an uber-chalky tight end it might be worth the occasional dart throw.

The Bottom Line
- Since tight end scoring is mostly concentrated among a handful of players, scoring at the position stabilizes relatively fast. When using past fantasy production to predict future fantasy success for tight ends, the optimal sample size is three to four games.
- Targets and target share are among the most predictable numbers in relation to tight end scoring and also stabilize after about three games.
- Target share is important to track because it helps us uncover potential breakouts when a team might suddenly see an increase in passing. This is why garbage time can be beneficial for pass-catchers—especially on DraftKings—but not as much for quarterbacks.
- Betting odds show little correlation to tight end scoring overall, but can still be useful. Big games are most likely to come from tight ends that are home favorites. Since opposing passing games correlate, road underdogs have typically offered some upside as well.
- Games are higher scoring when the home team is favored than when the home team is an underdog, but betting odds aren’t accounting for this. We can take advantage of this by targeting low-owned home favorites or road dogs while fading high-ownership games when the home team is the underdog.
- Salary-based scoring expectation suggests paying up for a premium tight end or saving as much as possible in cash games. Don’t “middle” the position.
- Ownership is linear at tight end and there has been an equal mix of chalk and contrarian plays among winners. Especially on FanDuel, where it’s easier to jam in multiple high-priced players, a good rule of thumb is that if you are going to eat the chalk, do so with a premium tight in optimal conditions.
- In the rare case that you are going to flex a tight end in a tournament, it should be to make a popular game stack contrarian or to complete a stack that will offset an uber-chalky second tight end
Thank you to Sam Hoopen for compiling the data used in this article. Follow Sam on Twitter @SamHoppen.


