NFL DFS Playbook: Wide Receiver Strategy Guide

This series has outlined how to research the quarterback and running back position, highlighting which stats are most relevant to each position and how past performance correlates to future outcomes.
In this DFS Playbook feature, wide receivers take center stage as we explore data to help find the most likely outcomes for receivers in cash games as well as how to approach the position in tournaments relative to salary and ownership.
DFS Playbook 2021: QB | RB | TE | DEF
How to Predict Fantasy Scoring for Wide Receivers
Use Relevant Sample Sizes
Projecting pass-catchers is a tough task when compared to projecting quarterbacks or running backs because pass-catchers simply touch the ball less. While quarterback and running back scoring is likely to approach volume-based expectations even within a single season, pass-catchers are prone to massive variance. Even the most heavily targeted wide receivers are lucky to touch the ball 10 times in a game meaning high-volume receivers can easily be out-scored by their low-volume counterparts depending on touchdown luck.
Because of that variance, it can be difficult to decide if a wide receiver’s recent performance is signal or noise. In order to get a clearer idea of how a receiver’s past fantasy scoring can predict future success, we looked at fantasy points for every wide receiver game over the last three seasons and the relationship between their performance in one game to their per-game average for every possible sample size (1 game to 15 games) before that game.
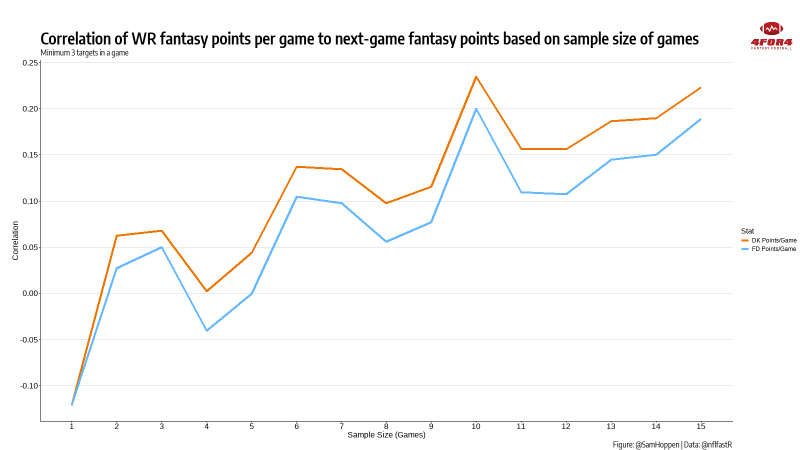
The peak for the optimal sample size for predicting wide receiver scoring is 10 games but the trend line is steadily rising. More so than any other position, when using in-season fantasy scoring to predict future success for wide receivers, the larger the sample size the better.
Even at the 10-game peak, though, the relationship between fantasy points scored in the past and fantasy points scored in the upcoming game is quite weak compared to other positions. Because of that, we should look to other more predictable metrics when analyzing wide receivers before turning to fantasy points.
Which Wide Receiver Stats are the Most Predictable
While it can take almost an entire season to get a remotely relevant sample of games when studying wide receiver fantasy scoring, one stat offers some predictable value in a relatively short time span: targets.
| Stat | Correlation to DK Points | Correlation to FD Points |
|---|---|---|
| Targets | 0.28 | 0.26 |
| Receptions | 0.28 | 0.26 |
| Receiving Yards | 0.28 | 0.26 |
| Target Share | 0.27 | 0.25 |
| Air Yards Share | 0.19 | 0.18 |
| Yards/Target | 0.10 | 0.09 |
| Average Depth of Target | -0.02 | 0.00 |
Table: @SamHoppen| Data: @nflfastR
The above data shows how next-game fantasy points on both FanDuel and DraftKings correlate to various wide receiver stats using a three-game historical average (1) of those stats. With yards and receptions being a direct function of targets, it’s intuitive that those two stats also carry some weight when looking at next-game scoring.
Target and target share go hand-in-hand but it’s worth touching on the nuance between the two since there can be added value in going out of your way to seek target share numbers rather than just looking at raw volume.
The benefit of understanding target share comes from situations when a team that typically doesn’t throw much is expected to see a big uptick in throwing—this might be due to a change in personnel or when a team is going into a game as a big underdog. A pass-catcher on that team might not pop if they are only seeing 6–7 targets per game but if those targets account for a high target share, fantasy players should expect that share to result in increased volume when team passing goes up—again, this should be intuitive but is worth pointing out.
This scenario is why garbage time is great for wide receivers but not so good for quarterbacks like some might suggest. Consider a situation where a team is forced to throw late in the game because they are down big—they compile 75 passing yards on one drive but fail to score. In that situation, the quarterback gained three points of fantasy production, relevant but not week-changing. However, if his primary receiver caught four of his passes for 50 yards on that drive, that’s suddenly nine fantasy points on a full PPR site for the receiver. On DraftKings, there might even be three more points if the receiver hits the 100-yard mark on that drive. A wide receiver who was having a sub-par day might suddenly be part of a tournament-winning lineup because of garbage time.
Using Betting Lines for Wide Receiver Projections
Using betting lines is a tricky proposition for wide receivers since wide receivers score in so many different ways. The above garbage time scenario might work on DraftKings but doesn’t help as much on FanDuel where scoring is half-PPR and there are no yardage bonuses.
On FanDuel, where touchdowns carry more weight, teams with high implied totals have extra value—if a wide receiver accounts for almost all of his team’s red zone targets, though, that player might have as much value on a team with a low implied total as another pass-catcher on a high-scoring team. Furthermore, low-volume deep threats can pop at any moment, regardless of game flow or scoring expectations.
Because of these and countless other factors that make fantasy scoring so unpredictable for pass-catchers, betting odds correlate to fantasy points less for wide receivers than for running backs or quarterbacks by a significant margin.
| Betting Odds | Correlation to DK Points | Correlation to FD Points |
|---|---|---|
| Implied Team Total | 0.16 | 0.16 |
| Over/Under | 0.14 | 0.14 |
| Spread | -0.10 | -0.10 |
Table: @SamHoppen| Data: @nflfastR
As was the case with running backs, there are so many usable players at the position, that a correlation between all receivers and different receiver types to betting odds doesn’t tell the whole story. By teasing out the highest-scoring fantasy games and seeing where they come from in relation to betting odds, we can hopefully gain some clarity on how to use betting odds for wide receivers.
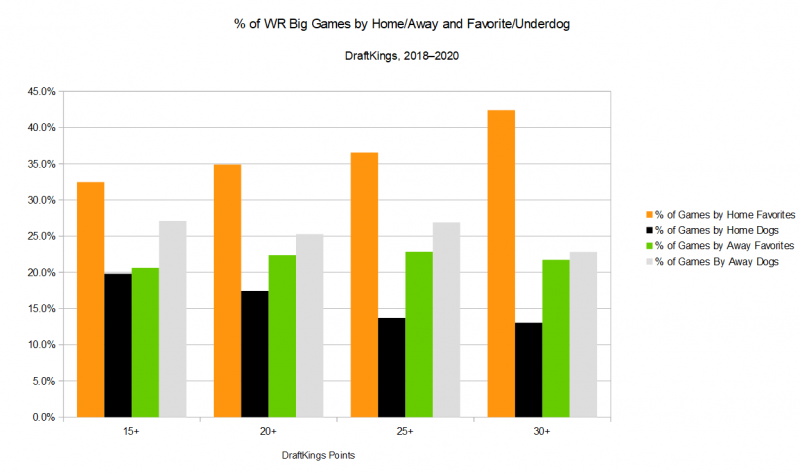
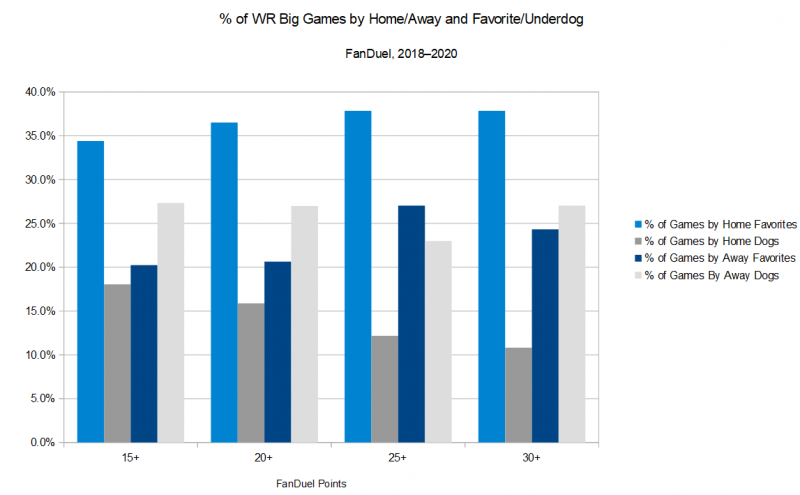
While betting lines might not correlate much to overall fantasy scoring at wide receiver, the fact is that the most likely scenario for a big fantasy day from a receiver is when his team is the home favorite. This makes sense when we recall that quarterback scoring correlates to betting odds more than any other position and quarterback and receiver scoring are highly correlated.
What might not be so intuitive is why road underdogs have more big games than home underdogs or even road favorites. The answer is two-fold—opposing passing games are highly correlated and NFL games are higher scoring when the home team is a favorite. Over the last five seasons, when the home team is favored the average combined score of both teams is just under 47 points; when the home team is an underdog, the average is 45.
If betting odds are already accounting for this, then it doesn’t matter to us, but they aren’t—over/unders in games where the home team is the favorite averaged 45.9 points; for home dogs, the average is 45.6. While there is some discrepancy in over/unders for those situations, the gap isn’t as big as reality.
This not only explains why we are seeing more big games from running backs and wide receivers when they are road dogs—a higher-scoring game means more fantasy points—but possibly gives us an edge to exploit if Vegas isn’t properly adjusting. We can fade players in popular games when the home team is an underdog or we can heavily target unpopular road dogs and home favorites.
Beyond point spreads, there is strong evidence that the higher a team’s implied total, the more likely wide receivers are to have a big game. Consider DraftKings where a team with an implied point total under 21 only produced a 25-point receiver 11% of the time; with an implied total between 21 and 24 that rose to 15%, with a 24% chance when the total was between 24 and 28 and all the way up to 34% with an implied team total over 28 points. FanDuel saw similar results.
For tournaments, ownership will often reflect implied point totals but we can leverage the most likely big high-scoring fantasy games in cash by looking for high-volume receivers with a high implied total.
Salary-Based Point Expectation
Over the last two seasons, wide receiver salary has had a 0.55 correlation to fantasy scoring on DraftKings and 0.49 on FanDuel, the second strongest relationship of any position on both sites. This might be surprising since wide receiver is such a high-variance position but we must remember that these correlations include a lot of low-salary receivers that score almost no points. When we extract only fantasy-relevant receivers—players projected for at least five fantasy points—the correlation drops to about 0.35 for both sites.
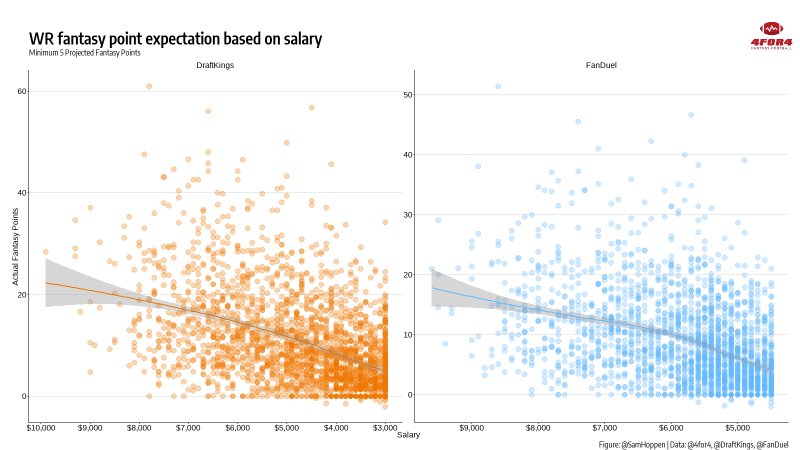
Unlike running backs, where the trendline for salary versus fantasy points pointed sharply downward, the scoring decent is more gradual for wide receivers. In other words, it’s not uncommon for lower-priced wide receivers to score as much as higher-salary receivers.
Because of the unpredictable nature of the position, successful DFS players have typically paid up for one stud receiver in cash games at the most, more often opting for a stars and scrubs approach with salary allocated heavily towards running backs and possibly a stud quarterback or tight end while saving at wide receiver. This also explains why you rarely see successful cash game players flex a receiver, even on DraftKings.
Building an expected points model such as the one here allows 4for4 to project value in a non-linear fashion and use our fantasy point projections to model the likelihood of wide receivers hitting cash or GPP expectations.
With these models, cash game players can consider all of the factors outlined in the previous section and ultimately compare receivers to other positions without faulty metrics such as simple points per dollar.

How to Pick Wide Receivers in DFS GPPs
If wide receiver is a high-variance position, then it might follow that it would make sense to go against the grain at the position in large-field tournaments. While this may be true to an extent, it doesn’t capture how winning players are targeting the position with the most required starting slots on the roster.
Using data from the DraftKings Millionaire and the FanDuel Sunday Million over the last two seasons, we can see how the best lineups approached the wide receiver position in terms of both ownership percentages and salary.
Wide Receiver Ownership Percentages
The idea that you can get unique at wide receiver in DFS tournaments is true but that ignores the fact that you have up to four wide receiver slots available to you if you decide to flex the position. In fact, DFS tournament winners have typically rostered at least one somewhat chalky receiver, with the WR1(2) in winning Millionaire and Sunday Million lineups carrying the second-highest average ownership behind only a team’s RB1.
Since the beginning of 2019, only one Milly winner hasn’t rostered a receiver with at least 10% ownership and just two Sunday Million winners have done so. Roughly 40% of winning Millionaire lineups have had a receiver with over 20% ownership with over half of Sunday Million winners rostering at least one such receiver.
How winners have approached their second most popular receiver has been a mixed bag on both sites with both Millionaire and Sunday Million winners averaging about 12% ownership on their WR2. The third required wide receiver is where tournament players have an opportunity to separate themselves from the field—only the flex has averaged lower ownership than the WR3 in winning Millionaire lineups while the flex and defense have just slightly lower average ownership among Sunday Million winners.
Across both sites over the last two seasons, only three winners of the weekly main event have rostered three receivers with ownership below 10%.
| Week | WR1 DraftKings 2019 | WR1 DraftKings 2020 | WR2 DraftKings 2019 | WR2 DraftKings 2020 | WR3 DraftKings 2019 | WR3 DraftKings 2020 | WR1 FanDuel 2019 | WR1 FanDuel 2020 | WR2 FanDuel 2019 | WR2 FanDuel 2020 | WR3 FanDuel 2019 | WR3 FanDuel 2020 |
|---|---|---|---|---|---|---|---|---|---|---|---|---|
| 1 | 12.0 | 19.0 | 8.4 | 10.1 | 0.3 | 8.3 | 20.9 | 18.7 | 7.5 | 13.8 | 4.1 | 12.7 |
| 2 | 20.8 | 17.5 | 1.8 | 13.4 | 0.6 | 11.9 | 8.6 | 17.8 | 3.9 | 11.9 | 0.6 | 9.9 |
| 3 | 15.4 | 23.3 | 11.3 | 17.9 | 10.4 | 6.8 | 13.2 | 34.7 | 11.2 | 21.3 | 1.8 | 6.0 |
| 4 | 16.5 | 15.8 | 3.1 | 10.3 | 0.7 | 9.1 | 23.3 | 16.5 | 3.8 | 13.1 | 0.6 | 9.4 |
| 5 | 23.7 | 30.4 | 18.5 | 29.9 | 14.8 | 18.0 | 20.3 | 20.5 | 14.7 | 18.4 | 11.1 | 0.5 |
| 6 | 11.7 | 13.3 | 8.6 | 9.8 | 1.8 | 4.0 | 21.8 | 20.4 | 15.4 | 15.9 | 11.0 | 5.9 |
| 7 | 16.6 | 23.2 | 5.0 | 10.0 | 2.3 | 9.6 | 14.4 | 19.7 | 1.8 | 13.1 | 1.7 | 9.2 |
| 8 | 24.3 | 15.4 | 10.3 | 12.7 | 8.7 | 12.2 | 31.5 | 16.0 | 11.3 | 13.8 | 7.0 | 7.3 |
| 9 | 15.7 | 14.5 | 13.0 | 10.7 | 9.8 | 7.6 | 25.9 | 10.4 | 23.9 | 9.2 | 12.8 | 8.6 |
| 10 | 44.6 | 16.1 | 24.7 | 10.8 | 12.9 | 4.5 | 38.6 | 18.2 | 27.7 | 9.1 | 17.1 | 2.5 |
| 11 | 25.5 | 24.7 | 6.1 | 14.7 | 5.9 | 14.3 | 26.0 | 26.7 | 13.1 | 13.6 | 9.7 | 10.7 |
| 12 | 11.7 | 21.6 | 5.2 | 20.8 | 3.4 | 3.0 | 35.9 | 26.6 | 11.8 | 19.7 | 10.4 | 14.6 |
| 13 | 22.5 | 23.2 | 17.0 | 17.4 | 12.5 | 9.1 | 16.9 | 20.4 | 13.5 | 8.1 | 11.7 | 3.4 |
| 14 | 16.3 | 6.1 | 6.2 | 5.8 | 2.1 | 1.4 | 12.3 | 12.4 | 10.1 | 9.8 | 8.4 | 0.4 |
| 15 | 22.3 | 10.5 | 12.3 | 7.0 | 7.8 | 6.0 | 7.4 | 30.1 | 5.0 | 11.0 | 5.0 | 10.9 |
| 16 | - | 16.7 | - | 15.9 | - | 10.1 | 27.5 | 16.8 | 20.5 | 11.9 | 16.3 | 10.2 |
| 17 | 15.2 | 14.0 | 13.5 | 12.0 | 12.1 | 11.2 | 22.7 | 10.1 | 11.1 | 6.4 | 11.1 | 5.3 |
| Average | 19.7 | 18.0 | 10.3 | 13.5 | 6.6 | 8.7 | 21.6 | 19.8 | 12.1 | 12.9 | 8.3 | 7.5 |
How Much GPP Winners Spend on Wide Receivers
Given DraftKings’ full-PPR scoring, it’s logical that tournament winners typically spent more on wide receivers than on FanDuel, typically allocating about 36% of their salary to the three required wide receiver slots while Sunday Million winners have spent about 34%. This distinction is subtle but becomes a bit more notable when we see that DraftKings winners are spending more on their WR1 than any position except their RB1 while FanDuel winners salary allocation to WR1 is almost the same as that of their quarterback.
On the extremes, it’s rare to see winners of large-field GPPs completely punt wide receiver on either site. Just four Millionaire winners in this sample have spent less than $6,000 on all three required receiver slots and four Sunday Million winners have spent less than $7,000 on all three.
Conversely, a spend-up strategy wasn’t the greatest option either with four Milly winners using at least $6,000 on all three required receivers and just five FanDuel winners spending over $6,500 on each receiver.
Like with all positions and roster builds, how to allocate salary is week-dependent but studying trends of the best lineups can give us a loose framework to work around.
| Week | WR1 DraftKings 2019 | WR1 DraftKings 2020 | WR2 DraftKings 2019 | WR2 DraftKings 2020 | WR3 DraftKings 2019 | WR3 DraftKings 2020 | WR1 FanDuel 2019 | WR1 FanDuel 2020 | WR2 FanDuel 2019 | WR2 FanDuel 2020 | WR3 FanDuel 2019 | WR3 FanDuel 2020 |
|---|---|---|---|---|---|---|---|---|---|---|---|---|
| 1 | $8,100 | $7,300 | $4,500 | $6,700 | $3,800 | $6,100 | $6,900 | $8,000 | $6,300 | $6,800 | $5,600 | $6,600 |
| 2 | $5,200 | $6,800 | $4,700 | $6,300 | $3,500 | $4,700 | $5,300 | $7,400 | $5,200 | $7,100 | $4,700 | $5,200 |
| 3 | $7,300 | $6,500 | $7,000 | $6,400 | $6,600 | $5,500 | $7,800 | $6,800 | $7,100 | $6,500 | $6,000 | $5,700 |
| 4 | $6,500 | $6,700 | $6,100 | $5,800 | $6,000 | $5,400 | $7,100 | $7,100 | $7,100 | $6,600 | $7,000 | $5,600 |
| 5 | $6,900 | $6,900 | $6,600 | $5,900 | $4,500 | $4,800 | $7,700 | $8,700 | $6,900 | $5,800 | $6,500 | $4,900 |
| 6 | $6,000 | $6,700 | $5,900 | $6,000 | $4,500 | $4,600 | $8,500 | $8,600 | $6,400 | $8,200 | $5,800 | $5,900 |
| 7 | $6,300 | $8,200 | $5,500 | $7,900 | $5,000 | $6,600 | $8,000 | $9,000 | $6,300 | $8,900 | $5,600 | $7,400 |
| 8 | $6,600 | $7,500 | $6,400 | $3,500 | $5,800 | $3,200 | $7,700 | $7,800 | $7,400 | $7,400 | $6,700 | $5,400 |
| 9 | $7,500 | $7,000 | $7,200 | $6,500 | $4,600 | $4,700 | $7,500 | $7,200 | $6,700 | $5,900 | $5,700 | $5,700 |
| 10 | $8,300 | $7,700 | $7,700 | $5,200 | $5,200 | $4,700 | $8,700 | $7,900 | $6,300 | $6,100 | $5,700 | $5,400 |
| 11 | $6,400 | $7,400 | $5,500 | $6,300 | $4,700 | $5,900 | $7,300 | $8,000 | $6,000 | $7,900 | $5,900 | $6,400 |
| 12 | $6,400 | $7,800 | $6,300 | $6,300 | $5,000 | $5,200 | $7,800 | $8,600 | $6,900 | $7,000 | $6,700 | $5,900 |
| 13 | $5,700 | $6,900 | $5,500 | $5,900 | $5,100 | $5,100 | $7,800 | $9,500 | $6,500 | $6,100 | $6,000 | $5,400 |
| 14 | $5,800 | $7,300 | $5,300 | $6,800 | $5,100 | $4,700 | $8,600 | $9,000 | $6,100 | $7,000 | $5,600 | $4,900 |
| 15 | $7,700 | $8,200 | $4,500 | $5,800 | $3,600 | $5,700 | $7,500 | $8,600 | $6,400 | $6,900 | $5,400 | $6,100 |
| 16 | - | $6,200 | - | $4,700 | - | $4,500 | $9,000 | $7,000 | $8,000 | $6,000 | $6,300 | $6,000 |
| 17 | $5,400 | $7,200 | $5,100 | $6,900 | $4,700 | $5,100 | $7,200 | $6,100 | $6,500 | $6,000 | $5,900 | $5,500 |
| Average | $6,631 | $7,194 | $5,863 | $6,053 | $4,856 | $5,088 | $7,671 | $7,959 | $6,594 | $6,835 | $5,947 | $5,765 |
Deciding Who to Use in the Flex in GPPs
The sample of Millionaire winners from 2020 would suggest that flexing a wide receiver is the preferred strategy in tournaments, with 10 of 17 winners opting for a fourth receiver. If we go back to 2019, though, just five Milly winners used a receiver in their flex (3) and data from 2018 shows almost an even split between wide receivers and running backs. In reality, the optimal strategy depends on a variety of factors within a given week since DK’s scoring system gives receivers just as much upside as running backs, if not more—over the course of the season, a balanced approach between running back and wide receiver in the flex is likely best.
When flexing a wide receiver, Millionaire winners have spent about $4,100 with average ownership of around 4%. Just two winners have spent at least $5,000 on four receivers and only four have used at least $4,500 on all four when flexing the position. No Millionaire winner over the last two seasons has rostered four receivers with ownership all over 10%.
Sunday Million tournament winners have typically favored running backs in the flex but not overwhelmingly so—just over a third of winners have won with a fourth wide receiver on their roster. It’s notable that winning lineups on FanDuel have typically spent less on their flex when it was a receiver, using about $5,500, compared to roughly $6,000 when flexing a running back. Similarly, FanDuel winners have been more contrarian with their fourth receiver than they have with their third running back—receivers in the flex have carried average ownership around 6% but that number has typically been above 7% when flexing a running back.
| Season | Week | Ownership | Salary |
|---|---|---|---|
| 2020 | 1 | 2.9 | $4,900 |
| 2020 | 5 | 1.2 | $4,100 |
| 2020 | 7 | 5.0 | $4,200 |
| 2020 | 8 | 2.4 | $3,100 |
| 2020 | 9 | 0.6 | $3,200 |
| 2020 | 10 | 4.3 | $3,500 |
| 2020 | 11 | 7.8 | $5,000 |
| 2020 | 15 | 2.5 | $3,900 |
| 2020 | 16 | 5.3 | $4,100 |
| 2020 | 17 | 7.8 | $4,200 |
| 2019 | 2 | 0.6 | $3,400 |
| 2019 | 4 | 1.3 | $4,600 |
| 2019 | 8 | 8.6 | $5,000 |
| 2019 | 9 | 8.7 | $4,200 |
| 2019 | 11 | 3.9 | $4,000 |
| Average | 4.2 | $4,093 |
| Season | Week | Ownership | Salary |
|---|---|---|---|
| 2020 | 1 | 1.8 | $5,500 |
| 2020 | 7 | 8.5 | $5,400 |
| 2020 | 9 | 6.0 | $5,500 |
| 2020 | 11 | 8.3 | $5,900 |
| 2020 | 13 | 0.7 | $5,400 |
| 2020 | 16 | 7.8 | $5,800 |
| 2020 | 17 | 10.1 | $5,000 |
| 2019 | 5 | 9.2 | $5,700 |
| 2019 | 9 | 4.5 | $5,500 |
| 2019 | 11 | 5.5 | $5,500 |
| 2019 | 12 | 9.7 | $6,400 |
| 2019 | 14 | 2.0 | $5,400 |
| Average | 6.2 | $5,583 |
The Bottom Line
- More than any other position, when using past fantasy production to predict future fantasy success for wide receivers, the larger the sample size, the better.
- Targets and target share are among the most predictable numbers in relation to wide receiver scoring and stabilize relatively fast, often after about three games.
- Target share is important to track because it helps us uncover potential breakouts when a team might suddenly see an increase in passing. This is why garbage time can be beneficial for pass-catchers—especially on DraftKings—but not as much for quarterbacks.
- Betting odds show little correlation to wide receiver scoring overall, but that doesn’t mean they aren’t useful. Big games are most likely to come from receivers that are home favorites. Since opposing passing games correlate, road underdogs have typically offered some upside in terms of wide receiver fantasy scoring.
- Games are higher scoring when the home team is favored than when the home team is an underdog, but betting odds aren’t accounting for this. We can take advantage of this by targeting low-owned home favorites or road dogs while fading high-ownership games when the home team is the underdog.
- Salary-based scoring expectations show that lower-salary receivers often score as much as more expensive receivers. A non-linear expected points model allows 4for4 subscribers to see value across positions in an apples-to-apples manner and often shows that saving at wide receiver in cash games is the most profitable strategy. Successful cash game players rarely flex a wide receiver.
- Winners in tournaments haven’t been overly contrarian when rostering wide receivers, usually using one relatively popular wide receiver and one to two sub-10% receivers. It’s rare that tournament winners spend all the way up or all the way down at all three required receiver spots.
- Whether or not to flex a wide receiver in tournaments is week-dependent, and should be used about half the time on DraftKings. FanDuel tournaments favor running backs in the flex but wide receivers are still in winning lineups over a third of the time. When winners on FanDuel have used receivers in the flex, they have typically spent less and been more contrarian than when flexing a running back.
Thank you to Sam Hoopen for compiling the data used in this article. Follow Sam on Twitter @SamHoppen.
Footnotes
- While 10 games is the optimal sample size for running backs, there is a peak after three games which gives us a larger sample size of running back with a continuous rolling average. (Back)
- Note that designations such as WR1 refer to the highest-priced back or back with the highest ownership on each roster. Consequently, the WR1 in terms of salary may not necessarily match up with the WR1 in terms of ownership. (Back)
- For this study, the flex was defined as the lowest-owned RB3 or WR4 on a roster. In practice, the player in the actual flex spot should be the player with the latest starting time possible in order to maximize late-swap options. (Back)


