FFPC Win Rates: Wide Receivers

Wide receiver is a challenging position to evaluate. As passing games evolve, so does on-field deployment for receivers. Plus, each player wins differently. The nuance is fascinating. But, again, challenging when building a best-ball roster.
More FFPC Content: Roster Construction | Win Rates: TEs | Win Rates: RBs | Win Rates: QBs
We have so many archetypes of receivers to draft nowadays. From X receivers to deep-ball mavens, their on-field utility translates to fantasy points. However, their value rises and falls throughout each part of the draft. Luckily, our friends at FantasyMojo have some data to help sort through it. Starting with what worked last year, I’ll dig into each phase for what to look for in 2022.
Highest WR Win Rates
| Rank | Player | Roster Win Rate | ADP |
|---|---|---|---|
| 1 | Cooper Kupp | 33.4% | 4.05 |
| 2 | Deebo Samuel | 19.7% | 8.04 |
| 3 | Ja'Marr Chase | 14.6% | 5.11 |
| 4 | Mike Williams | 14.6% | 9.08 |
| 5 | Davante Adams | 13.8% | 1.07 |
| 6 | Jaylen Waddle | 13.7% | 10.10 |
| 7 | Amon-Ra St. Brown | 13.0% | 20.02 |
| 8 | Elijah Moore | 11.7% | 11.11 |
| 9 | Christian Kirk | 11.6% | 20.12 |
| 10 | Diontae Johnson | 11.5% | 5.06 |
| 11 | Marquise Brown | 11.5% | 12.04 |
| 12 | Darnell Mooney | 11.2% | 10.06 |
(*) – ADP data is from August 2021
The names in the Top 12 underscore my sentiment from the intro. They’re all so different yet play the position. I see slot receivers and split-ends. We’ve got rookies and first-team All-Pro veterans. It’d be a stretch to sort them categorically as we’re touching the extremes of every spectrum worth considering. However, their draft cost does give us some insight.
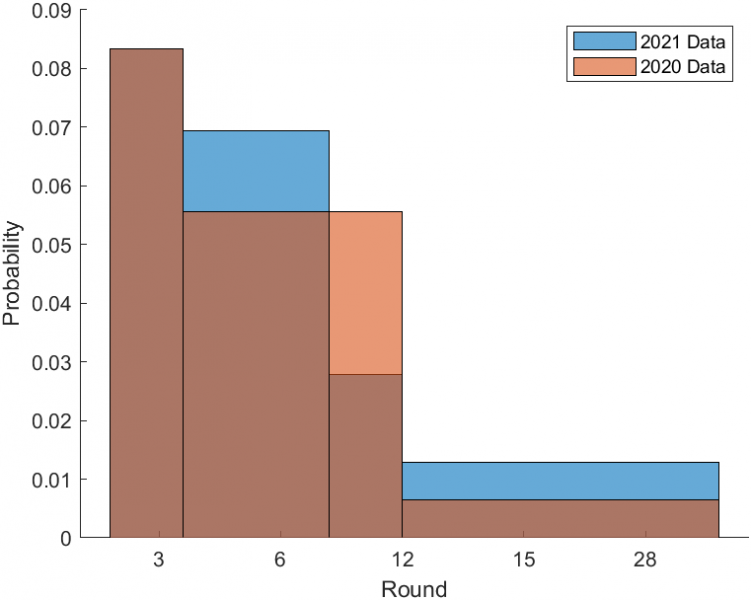
I used just the top-12 wide receivers in roster win rate and found the same behavior over the last two seasons. As the draft progresses, win rates decline. Intuitively, this makes sense. We’re at the bottom of team depth charts by the 15th round. Our expectations for a WR4 aren’t the same as a WR1. However, we drafted 164 receivers in 2020 and 2021. The average was 125 the two seasons prior. So, I looked at the top-36 receivers to confirm the trend with more in the rotation.
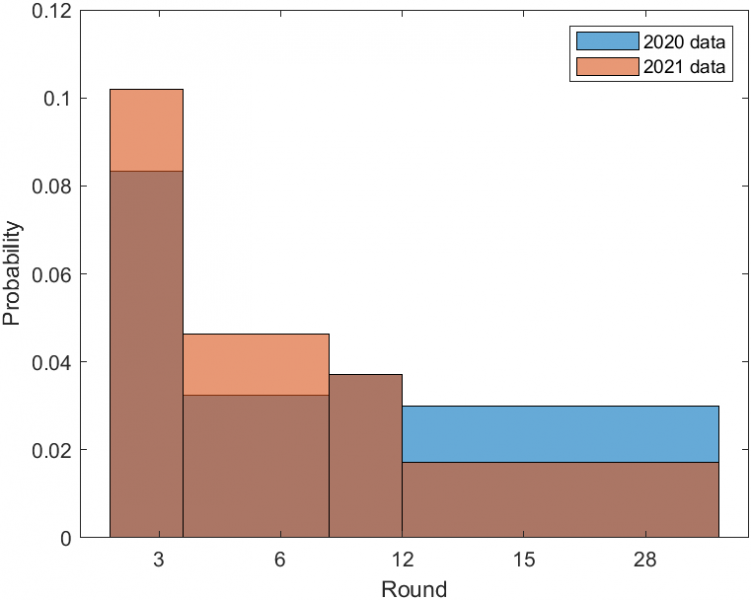
There’s a heavier bias towards the early rounds, but still a similar result. This conclusion would lead me to draft wide receivers with my first few picks. However, we’ve had an influx of talent shaking up the middle and late rounds.
| Season | Player | Rookie Season ADP | Target Share for First Month |
|---|---|---|---|
| 2021 | Ja'Marr Chase | 5.11 | 10.3% |
| 2021 | Jaylen Waddle | 10.10 | 8.0% |
| 2021 | Amon-Ra St. Brown | 20.02 | 5.0% |
| 2021 | Elijah Moore | 11.11 | 8.6% |
| 2020 | Justin Jefferson | 8.9 | 20.0% |
| 2020 | Brandon Aiyuk | 8.8 | 11.3% |
| 2019 | Deebo Samuel | 15.5 | 15.5% |
| 2019 | A.J. Brown | 21.1 | 14.3% |
| 2018 | Calvin Ridley | 16.8 | 14.5% |
| 2018 | D.J. Moore | 14.6 | 4.2% |
Typically, uncertainty suppresses a rookie’s average draft position (ADP). We can string together narratives for how good they’ll be all offseason. However, we don’t know. And their early-season target shares highlight the learning curve most go through transitioning to the NFL. Regardless, we start three to four receivers each week. We’ll need depth at the position. So while the early-rounders may be our foundation, the later phases can secure a late-season push. But let’s start with those first six rounds and see what profiles are worth targeting.
Early Rounds
| Rank | Player | Roster Win Rate | ADP |
|---|---|---|---|
| 1 | Cooper Kupp | 33.4% | 4.05 |
| 3 | Ja'Marr Chase | 14.6% | 5.11 |
| 5 | Davante Adams | 13.8% | 1.07 |
| 10 | Diontae Johnson | 11.5% | 5.06 |
Like I said before, the names give us a starting point. The majority of them are more expensive this year, but we can still find similar profiles. Let’s start with their on-field deployment.
| Player | Route Participation | Overall Target Share | Red-Zone Target Share | aDOT |
|---|---|---|---|---|
| Davante Adams | 93.5% | 32.8% | 22.8% | 9.7 |
| Cooper Kupp | 97.7% | 33.2% | 31.4% | 8.5 |
| Ja'Marr Chase | 97.0% | 24.2% | 22.1% | 13.9 |
| Diontae Johnson | 95.2% | 28.8% | 26.4% | 9.1 |
The early-round players in the Top 12 were ‘The Engine’ ™ of their team’s passing game. An overall target share of 24.0% or above isn’t enough. This group alone averaged over a quarter of the red-zone opportunities. Also, look at the average depth of target (aDOT).
Primary receivers typically fall into the 9-12 aDOT range due to their route diversification. Of course, there are outliers. But a large enough sample gives us a solid profile to bet on each year. I used the early-round receivers from the Top 12 since 2018 (22 players) and distilled their usage into a single analytical snapshot.
| Route Participation | Overall Target Share | RZ Target Share | aDOT |
|---|---|---|---|
| 94.9% | 25.9% | 24.2% | 11.25 |
I’m not saying guys like Mike Evans can’t make the Top 12. It’s just less likely. It’s effectively swapping weekly sustainability for a higher ceiling. We can see it in their fantasy ranks over a single season.
| Season | Player | Overall WR1 | Top 3 | Top 6 | Top 12 |
|---|---|---|---|---|---|
| 2021 | Davante Adams | 2 | 5 | 6 | 8 |
| 2021 | Cooper Kupp | 3 | 6 | 9 | 15 |
| 2021 | Ja'Marr Chase | 1 | 2 | 3 | 5 |
| 2021 | Diontae Johnson | 0 | 1 | 3 | 4 |
| 2020 | Davante Adams | 2 | 6 | 7 | 8 |
| 2020 | Tyreek Hill | 1 | 2 | 5 | 7 |
| 2020 | Adam Thielen | 0 | 2 | 4 | 7 |
| 2020 | Calvin Ridley | 2 | 4 | 4 | 6 |
| 2020 | D.K. Metcalf | 1 | 1 | 3 | 5 |
| 2020 | Stefon Diggs | 1 | 4 | 5 | 5 |
| 2020 | Will Fuller V | 0 | 2 | 2 | 3 |
| 2019 | Michael Thomas | 0 | 3 | 9 | 11 |
| 2019 | Mike Evans | 2 | 3 | 3 | 5 |
| 2019 | Tyler Lockett | 1 | 1 | 3 | 3 |
| 2019 | Chris Godwin | 2 | 3 | 5 | 5 |
| 2019 | Allen Robinson | 0 | 0 | 2 | 5 |
| 2018 | Davante Adams | 0 | 2 | 5 | 8 |
| 2018 | Amari Cooper | 2 | 2 | 2 | 3 |
| 2018 | Tyreek Hill | 3 | 5 | 5 | 7 |
| 2018 | Stefon Diggs | 1 | 1 | 4 | 6 |
| 2018 | Adam Thielen | 0 | 2 | 7 | 8 |
Eleven of the 24 overall-WR1 finishes belong to receivers with an aDOT of 13.0 or higher. But notice they’re one-hit wonders. Tyreek Hill is the only deep threat to repeat, but his aDOT dropped from 15.5 in 2018 to 13.4 when it happened again. At the same time, Hill’s red-zone target share jumped from 16.0% to 23.5%. It might seem coincidental, but it should make sense.
We expect our early-round picks to get volume. No surprise there. But the actual difference makers are the players with teams constantly trying to find new ways to get them the ball. Or, at least the receivers with the capability of being more than they were the prior season. Our targets should be not just WR1s for our fantasy teams but certified alphas on their own.
Favorite Early-Round Targets: Justin Jefferson (ADP: 1.05), CeeDee Lamb (2.07), and Mike Williams (5.05)
Middle Rounds
| Rank | Player | Roster Win Rate | ADP |
|---|---|---|---|
| 2 | Deebo Samuel | 19.7% | 8.04 |
| 4 | Mike Williams | 14.6% | 9.08 |
| 6 | Jaylen Waddle | 13.7% | 10.10 |
| 8 | Elijah Moore | 11.7% | 11.11 |
| 11 | Marquise Brown | 11.5% | 12.04 |
| 12 | Darnell Mooney | 11.2% | 10.06 |
Yes, Deebo Samuel’s on this list. No, I don’t know how to reverse engineer his profile and find ‘this year’s Deebo Samuel.’ My DMs are open if you know how to find the next player to create a new position. But I can at least use his receiving metrics to set the stage for the middle rounds.
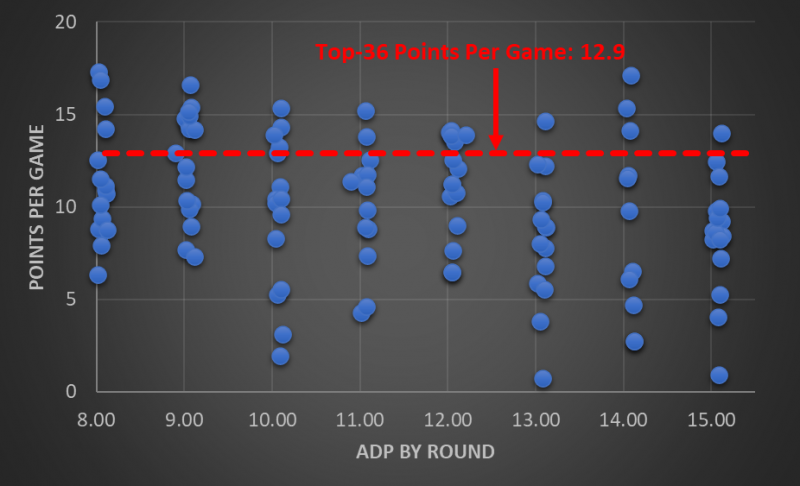
It may feel like the receiver runs leave you with less-appealing options, but don’t get too anxious. Since 2018, players with top-36 upside have been available in every middle round. Top-36 may not sound like much, but 62 receivers are gone by the end of the fifteenth round. If there’s potential for a player to jump 30 spots in value, sign me up. In either case, we need to know what to target.
| Season | Player | Overall WR1 | Top 3 | Top 6 | Top 12 |
|---|---|---|---|---|---|
| 2021 | Deebo Samuel | 1 | 4 | 6 | 9 |
| 2021 | Mike Williams | 1 | 2 | 2 | 5 |
| 2021 | Jaylen Waddle | 1 | 1 | 2 | 4 |
| 2021 | Elijah Moore | 1 | 2 | 2 | 3 |
| 2021 | Marquise Brown | 0 | 1 | 2 | 4 |
| 2021 | Darnell Mooney | 0 | 0 | 2 | 4 |
| 2020 | Justin Jefferson | 1 | 2 | 4 | 5 |
| 2020 | Diontae Johnson | 0 | 1 | 3 | 6 |
| 2020 | Brandon Aiyuk | 0 | 0 | 2 | 3 |
| 2020 | Will Fuller V | 0 | 2 | 2 | 3 |
| 2020 | Jamison Crowder | 0 | 0 | 1 | 4 |
| 2019 | John Brown | 1 | 1 | 1 | 3 |
| 2019 | Jamison Crowder | 0 | 0 | 1 | 5 |
| 2019 | Michael Gallup | 1 | 1 | 2 | 3 |
| 2018 | Kenny Golladay | 0 | 0 | 0 | 4 |
| 2018 | Robert Woods | 0 | 2 | 2 | 4 |
| 2018 | D.J. Moore | 0 | 0 | 1 | 1 |
| 2018 | Chris Godwin | 1 | 1 | 1 | 2 |
| 2018 | Mike Williams | 0 | 1 | 1 | 2 |
Again, Samuel skews the analysis, but the other names paint a better picture. We’re looking for 1Bs, WR2s, or a team’s second passing option. And, even focusing on 2021, it’s not a minor role.
The median target share for mid-round top-12 receivers in roster win rate was 24.0%. Their aDOT was 12.0. Most of these players could moonlight as their team’s primary target, but their utility was typically uncertain. Part of it was their age.
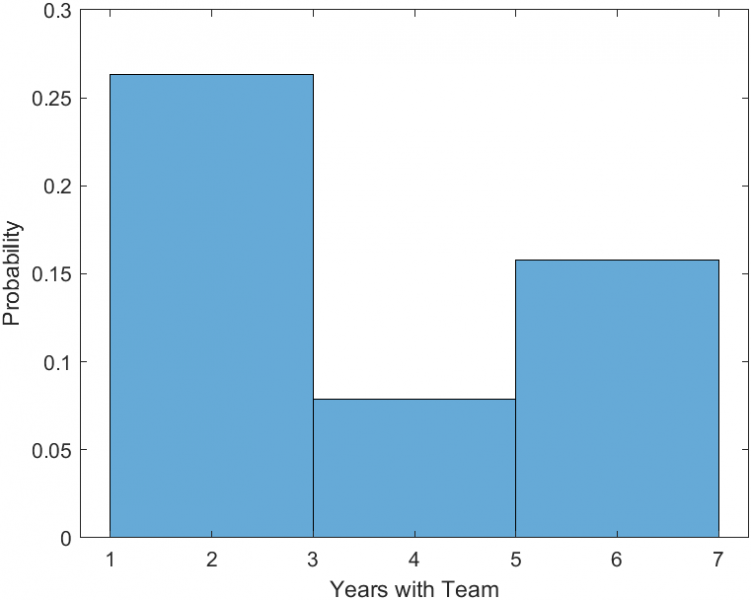
Earlier, I talked about rookie development and how the market values their first year. Unless they’re top-12 producers from the jump, we’re hesitant to boost their ADP. So, they fall into the middle rounds with everyone else. Receivers with three seasons or fewer under their belts accounted for 68.4% of the mid-round top-12 players. And, as I see three Jets’ pass-catchers on the list, their team situation wasn’t a significant factor.
Favorite Mid-Round Targets: Gabriel Davis (ADP: 7.09), Allen Lazard (12.05), Marquez Valdes-Scantling (13.07)
Late Rounds
| Rank | Player | Roster Win Rate | ADP |
|---|---|---|---|
| 7 | Amon-Ra St. Brown | 13.0% | 20.02 |
| 9 | Christian Kirk | 11.6% | 20.12 |
I prioritize kickers and defenses once we get into the late rounds. I’ve already drafted about six receivers by this time and can take a chance or two. But I have no expectations.
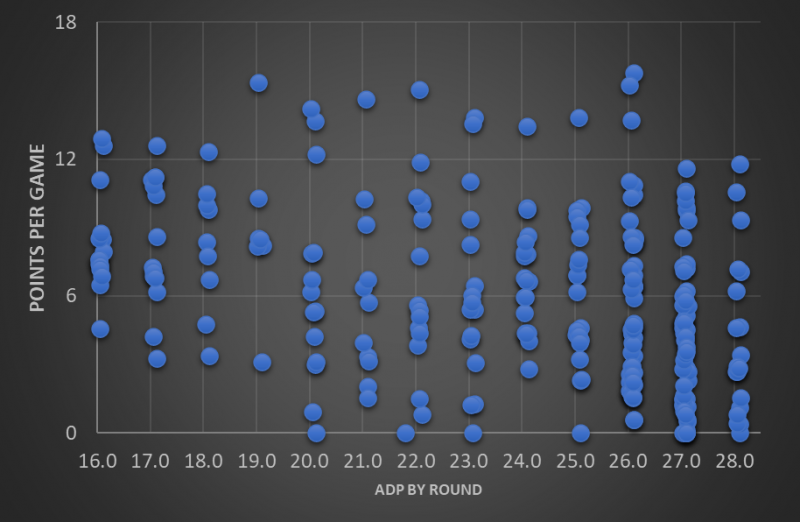
We’re mining the bottom of team depth charts, which shows in the boxscores. Since 2018, 52.0% of the players drafted have averaged 6.0 or fewer points per game. However, the last four years have given us some idea of what to look for in the late rounds.
| Season | Player | Overall WR1 | Top 3 | Top 6 | Top 12 |
|---|---|---|---|---|---|
| 2021 | Amon-Ra St. Brown | 0 | 1 | 4 | 5 |
| 2021 | Christian Kirk | 0 | 0 | 1 | 2 |
| 2020 | Corey Davis | 1 | 1 | 2 | 3 |
| 2019 | Devante Parker | 1 | 1 | 1 | 5 |
| 2019 | D.J. Chark | 0 | 1 | 2 | 4 |
| 2019 | Deebo Samuel | 0 | 1 | 1 | 4 |
| 2019 | A.J. Brown | 0 | 1 | 3 | 5 |
| 2018 | Calvin Ridley | 1 | 1 | 1 | 3 |
Let’s focus on the weekly ranks first. Late-round receivers in the roster win rate Top 12 averaged four WR1 finishes and had at least one week as a top-6 receiver. Of course, we’d like to see our guys finish at the top spot, but we’ve already outkicked our draft cost by this point. At a minimum, they’ve jumped 50 receivers in value. And luckily, there are some commonalities to extract.
First, consider the volume required to result in this level of production. It’s odd to find players with a median target share of 20.3% this late in the draft. But look at the names. They were all considered third or fourth options on their team to start the season. The Lions listed Amon-Ra St. Brown behind Quintez Cephus. We hyped up A.J. Green and Rondale Moore making Christian Kirk the cheapest of the trio. At some point, our pessimism creates value. And, as always, we should consider paths to more volume regardless of what we think we know at the time.
Favorite Late-Round Targets: Tim Patrick (ADP: 16.08), Jamison Crowder (18.08), and David Bell (21.12)

Bottom Line
- The probability of finding top-12 receivers decreases each draft phase, but rookie uncertainty creates pockets of value.
- At least two rookies have made the Top 12 in roster win rate since 2018. Last season featured the most (4).
- Early-round wide receivers should be ‘The Engine’ ™ of their team’s passing game.
- Median metrics for a receiver drafted within the first six rounds on the roster win rate Top 12 were: 94.9% route participation, 25.9% target share, 24.2% red-zone target share, and an 11.3 aDOT.
- Mid-round wide receivers had a median target share of 24.0% with a 12.0 aDOT.
- Younger receivers (three or fewer seasons with the team) accounted for 68.4% of the mid-round top-12 players.
- Late-round receivers carry low expectations as 52.0% of the players drafted have averaged 6.0 or fewer points per game.
- Receivers from the later rounds on the roster win rate Top 12 have earned a median target share of 20.3%.
- Roster uncertainty or pessimism is a commonality (e.g., Amon-Ra St. Brown, Christian Kirk) which drives down their ADP.