FFPC Win Rates: Tight Ends

The premium scoring format doesn't make drafting tight-ends any easier. We're still left with the daunting task of choosing which narrative we want to bet on over the offseason. T.J. Hockenson and Anthony Firkser are benefits of vacated targets. Mark Andrews and Noah Fant should see some positive offensive recoil after a down year in 2020. Adam Trautman is the next man up with Jared Cook's departure. It all makes sense to us over the summer and yet we all wind up watching Cameron Brate and Tyler Kroft waltz into the end zone each week. Tight-end production can seem fickle but I took a look at the last couple of years of data to break down the usage profiles and pull out some viable strategies for approaching the position in 2021.
Highest TE Win Rates
| Rank | Player | Win Rate | ADP |
|---|---|---|---|
| 1 | Travis Kelce | 19.5% | 1.10 |
| 2 | Darren Waller | 18.9% | 5.02 |
| 3 | Jimmy Graham | 12.3% | 20.03 |
| 4 | Mike Gesicki | 10.7% | 7.12 |
| 5 | Irv Smith Jr. | 10.3% | 12.04 |
| 6 | Mark Andrews | 10.2% | 3.05 |
| 7 | Jonnu Smith | 9.8% | 9.07 |
| 8 | T.J. Hockenson | 9.6% | 8.04 |
| 9 | Darren Fells | 9.3% | 22.12 |
| 10 | Eric Ebron | 9.2% | 12.10 |
| 11 | Rob Gronkowski | 9.2% | 8.08 |
| 12 | Gerald Everett | 9.1% | 15.03 |
Any Top-12 list featuring four players in their early 30’s should make you check it again. We expect our top athletes to be young and fast, but we know the tight-end position is different. It’s one that requires some development into a useful fantasy asset. Regardless, two general strategies exist regarding drafting a tight end. Either select an elite option early or take a walk down Narrative Street during the middle and late rounds. And a high-level view of the data would agree with either approach.
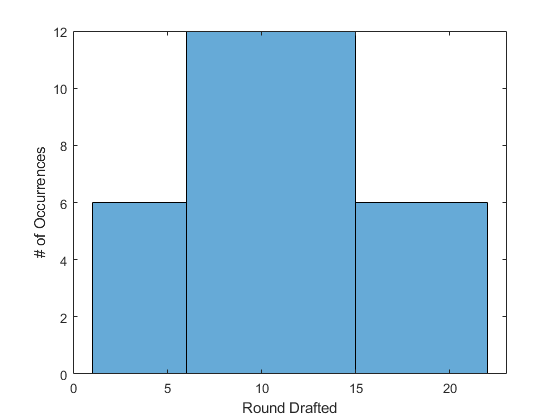
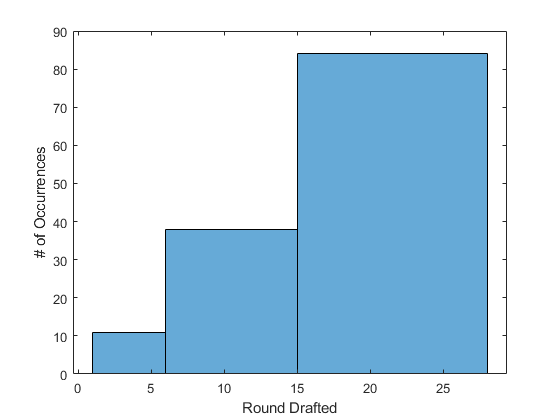
Three-quarters of the Top-12 TEs in win rate has been drafted by the 14th round over the last two seasons. Simply put, it’s been worth the opportunity cost to invest early. Early-round TEs comprise 25.0% of the group with another six TEs drafted prior to the 10th round. In a format that puts a premium on TE usage, we should be drafting those with the clearest path to production. But don’t get misled by the histogram. You *could* conclude that the same number of Top-12 tight-ends comes from the early and later rounds of the draft. With six coming from both phases, the results would seem to undermine the ‘draft TE early’ strategy. But the results don’t account for the number of TEs typically selected in each range.
I added in the ADPs of all TEs drafted over the last two years and the power of the early and mid-round TE becomes clear. We’ve collectively thrown darts at 79 different TEs in the late rounds and come away with six Top-12 hits. Conversely, the early rounds have produced a 76.9% hit rate. The market has been reasonably sharp at the start of the draft. Plus, the top two early-round builds drafted one TE before the sixth round. Let’s dive into the elite options at the start of the draft and see what we should expect from them and how to approach drafting them considering the associated opportunity cost.
Early Rounds
| Rank | Player | Win Rate | ADP |
|---|---|---|---|
| 1 | Travis Kelce | 19.5% | 1.10 |
| 6 | Mark Andrews | 10.2% | 3.05 |
| 2 | Darren Waller | 18.9% | 5.02 |
To be honest, I was surprised to see Andrews on the list. The reviews on the Ravens’ passing attack in 2020 have been lukewarm at best. But, his win rate speaks to the nature of the position. During the season, we’re happy if our tight-ends catch a couple of passes or get a red-zone target. However, top-end season-long production requires a significant share of the team’s passing opportunities. I broke down which components really mattered to start.
| Metric | r-squared |
|---|---|
| Yards | 0.978 |
| Receptions | 0.977 |
| Targets | 0.959 |
| Touchdowns | 0.760 |
I’ve used regression analyses to focus on which stats matter the most for fantasy scoring. And, similar to wide receivers, receiving yards have the highest correlation to fantasy points with receptions closely behind given the TE-prem scoring. Of course, it’s all tied to targets, but not all targets are the same. As such, I used a similar method for breaking down the targets for each Top-12 tight end over the last two seasons to calculate their Composite Opportunity score.
| Season | Player | ADP | RZ Target Share | % of Team's Yards | Composite |
|---|---|---|---|---|---|
| 2020 | Travis Kelce | 1.06 | 25.9% | 29.9% | 55.8% |
| 2020 | Mark Andrews | 3.05 | 28.1% | 25.5% | 53.6% |
| 2020 | Darren Waller | 5.02 | 48.9% | 28.9% | 77.8% |
| 2019 | Travis Kelce | 1.1 | 27.9% | 26.7% | 54.6% |
| 2019 | George Kittle | 2.08 | 23.0% | 26.2% | 49.2% |
| 2019 | Zach Ertz | 3.01 | 25.0% | 24.4% | 49.4% |
Early-round tight-ends have had a median composite opportunity share of 54.1% over the last two seasons. Obviously, Waller’s 77.8% share skews the median but by just 0.5% indicating some stability in the usage profile. As a result, tight-ends with raw target shares over 22.0% throughout the course of the season have generally been good bets. Additionally, their offensive situation doesn’t necessarily have to be perfect either. Just half of the Top 12 were above the league average in neutral passing rate and offensive yards per drive. Kelce was the only player on an offense that was Top 10 in red-zone passing rate. Again, we just need tight-ends with a clear path to a WR1 workload. And comparing tight-ends to wide receivers isn’t as outlandish of a comparison as you might think.
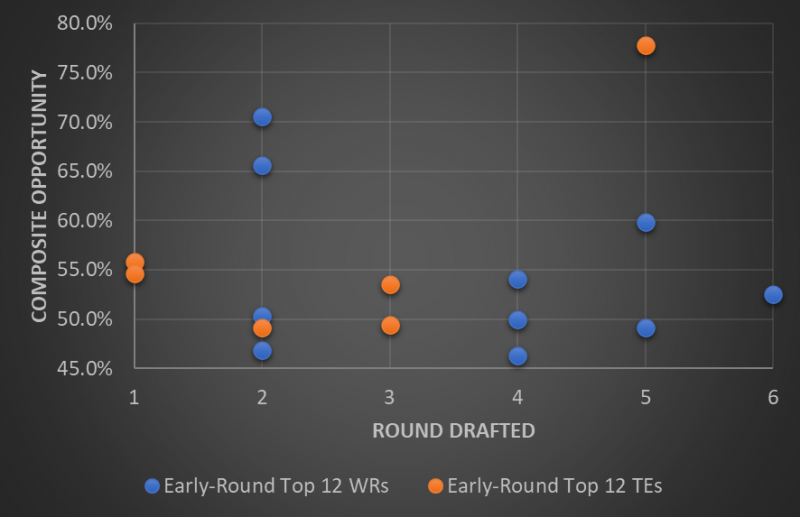
The median composite opportunity for Top-12 early-round wide receivers over the last two seasons is 51.5%. A value that falls short of the aforementioned 54.1% composite score for tight-ends. A comparison that provides another point in the favor of the early-round tight end. But we can’t go overboard. While drafting three tight-ends is optimal, opportunity cost is critical this early in the draft. With both running back and wide receiver to consider, any drafter would be taking on considerable risk drafting more than one.
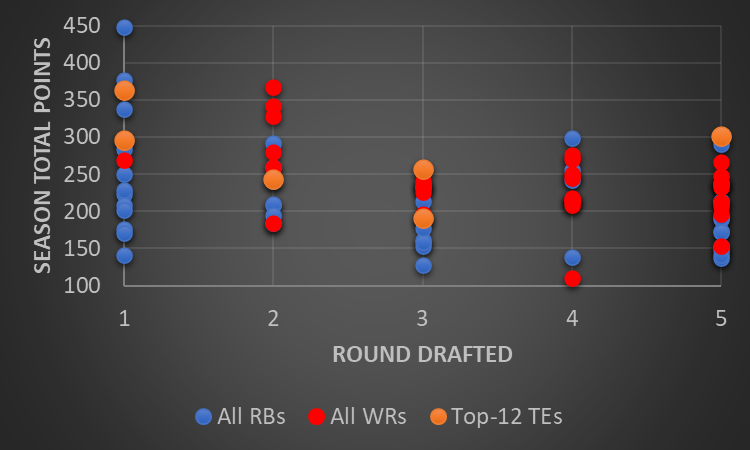
After the third round, tight-ends lose their leverage. And this trend is somewhat intuitive. Wide receiver scoring has a lesser decline rate and more viable options are available as we transition into the middle rounds. With quarterbacks entering the chaos of the draft by the fifth round, an optimal strategy will be to draft a single tight end while balancing your roster across the other core positions.
Favorite Early-Round TEs for 2021: Darren Waller (ADP: 1.10), T.J. Hockenson (ADP: 4.07), and Dallas Goedert (ADP: 6.06)
Middle Rounds
| Rank | Player | Win Rate | ADP |
|---|---|---|---|
| 4 | Mike Gesicki | 10.7% | 7.12 |
| 8 | T.J. Hockenson | 9.6% | 8.04 |
| 11 | Rob Gronkowski | 9.2% | 8.08 |
| 7 | Jonnu Smith | 9.8% | 9.07 |
| 5 | Irv Smith Jr. | 10.3% | 12.04 |
| 10 | Eric Ebron | 9.2% | 12.10 |
| 12 | Gerald Everett | 9.1% | 15.03 |
The group of mid-round tight-ends that made the Top 12 look like a list of streaming targets you’d seeing during the season. None were focal points of their offense, but at least secondary or tertiary options that gave them a viable floor. And that’s the profile we’re looking for in the middle rounds. Finding a tight end with a path to a low, but consistent target share is the optimal approach.
| Season | Player | ADP | RZ Target Share | % of Team's Yards | Composite |
|---|---|---|---|---|---|
| 2020 | Mike Gesicki | 7.12 | 21.2% | 18.5% | 39.7% |
| 2020 | T.J. Hockenson | 8.04 | 23.3% | 17.0% | 40.3% |
| 2020 | Rob Gronkowski | 8.08 | 17.6% | 14.0% | 31.7% |
| 2020 | Jonnu Smith | 9.07 | 23.5% | 12.2% | 35.7% |
| 2020 | Irv Smith Jr. | 12.04 | 25.0% | 11.0% | 36.0% |
| 2020 | Eric Ebron | 12.10 | 23.8% | 14.7% | 38.4% |
| 2020 | Gerald Everett | 15.03 | 5.4% | 9.9% | 15.3% |
| 2019 | Austin Hooper | 7.10 | 21.9% | 19.0% | 40.9% |
| 2019 | Mark Andrews | 9.12 | 26.7% | 26.2% | 52.8% |
| 2019 | Darren Waller | 11.06 | 17.5% | 28.3% | 45.8% |
| 2019 | Greg Olsen | 11.10 | 16.9% | 15.3% | 32.2% |
| 2019 | Jack Doyle | 13.02 | 14.5% | 14.0% | 28.5% |
| 2019 | Dallas Goedert | 13.06 | 14.7% | 14.6% | 29.3% |
The market rightly leveraged the collective knowledge surrounding Andrews and Waller in 2019. Regardless, their usage profile is what we want. Mid-round tight-ends have averaged 5.5 targets per game over the last two seasons. But, in a slight deviation from the early-round tight-ends, the quality of the offenses for each mid-round tight-end made a difference. For both offensive yards per drive and neutral passing rate, 61.5% of the Top-12 mid-round tight-ends were on above-average offenses. So we trade significant volume for steady targets and productive offenses to get us more chances at a touchdown. But the beginning of the middle rounds requires the most out of our tight-end selections.
Rounds 7 through 10 over the last two seasons have featured 10 quarterbacks, four running backs, and four wide receivers that have finished in the Top 12. The opportunity cost might drive drafters to wait until the end of the middle rounds to take their shots on a tight end. However, the value isn’t as stable as the draft continues.
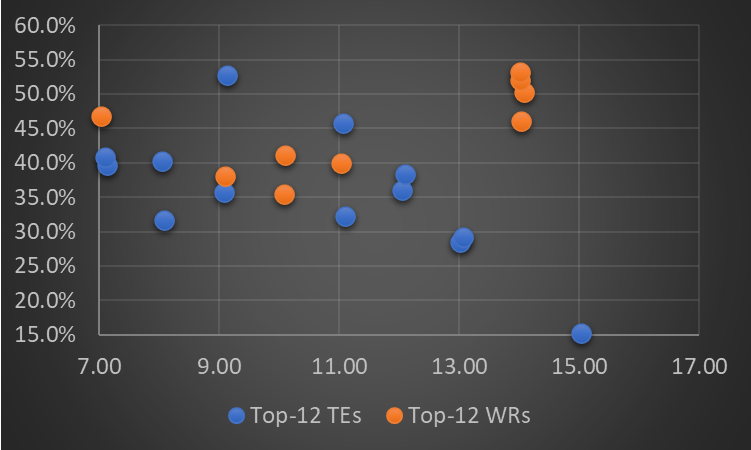
Composite opportunity drops from 41.0% in the first half of the middle rounds to 30.0% by the back half. Meanwhile, multiple Top 12 receivers have been available at a similar cost. As a result, the beginning of the middle rounds is the optimal range for taking another tight end.
Favorite Mid-Round TEs for 2021: Tyler Higbee (ADP: 7.08), Evan Engram (ADP: 9.10), Adam Trautman (ADP: 11.03), Anthony Firkser (ADP: 11.07), and Rob Gronkowski (ADP: 13.05).
Late Rounds
| Rank | Player | Win Rate | ADP |
|---|---|---|---|
| 3 | Jimmy Graham | 12.3% | 20.03 |
| 9 | Darren Fells | 9.3% | 22.12 |
Late-round tight-ends are like the cheap players we throw into the TE slot on our Milly Maker DFS lineups. We’re in the money if they hit. Otherwise, the cost isn’t critical. The rest of the roster can carry the duds to the finish line. Usage profiles for late-round tight-ends will be volatile at best, but we should expect them to have a role in the red zone.
| Season | Player | RZ Target Share | % of Team's Yards | Composite |
|---|---|---|---|---|
| 2020 | Jimmy Graham | 22.4% | 12.3% | 34.7% |
| 2020 | Darren Fells | 5.1% | 7.0% | 12.1% |
| 2019 | Mike Gesicki | 13.0% | 14.2% | 27.2% |
| 2019 | Gerald Everett | 19.0% | 13.6% | 32.7% |
We’re not relying on these guys for their yards. Their value comes in their ability to convert their red-zone opportunities into touchdowns. All but Everett were Top 20 in touchdowns scored by all tight-ends. Additionally, Everett’s team was the only squad that was below the league's average in red-zone passing rate. Therefore, we should be looking for tight-ends on relatively productive teams that prefer to pass once they’re inside the 20-yard line. Providing value with receiving yards is always welcome, but, at this stage of the draft, any chance at scoring a touchdown should be considered.
Favorite Late-Round TEs for 2021: Christopher Herndon (ADP: 16.01) and Dawson Knox (ADP: 21.05)
Bottom Line
Leaving Rounds 1-6 with at least one tight end is an optimal approach to drafting.
- Early-round tight-ends have had a median composite opportunity share of 54.1% over the last two seasons.
- Tight ends with raw target shares over 22.0% throughout the course of the season have generally been good bets in the early rounds.
- Just half of the tight ends in the Top 12 were on teams that were above the league average in neutral passing rate and offensive yards per drive.
In Rounds 7 -14, target tight-ends with stable or high floors in the middle rounds that are on productive offenses.
- Mid-round tight-ends have averaged 5.5 targets per game over the last two seasons.
- You're essentially trading significant volume for steady targets and productive offenses as 61.5% of the Top-12 mid-round tight-ends were on above-average offenses in terms of offensive yards per drive and neutral passing rate.
- Composite opportunity rapidly declines from 41.0% in the first half of the middle rounds to 30.0% by the end of the middle rounds.
Rounds 15-28 are about finding tight ends with minor passing roles but still used in the red zone.
- All but tight end was Top 20 in touchdowns scored by all tight-ends their respective season.
- Just one team was below the league average in red-zone passing rate.