TJ's #Taek: Week 10 NFL DFS GPP Recap

Week 10’s winning lineups from the biggest contests on FanDuel and DraftKings can be used to tease out lineup-building strategies and offer clues on how you could have landed on a similar team. Reviewing your hits and misses each week is imperative if you want to be a profitable DFS player but examining winning lineups is also a useful exercise in cultivating a winning approach.
More GPP Strategy: QB | RB | WR | TE | DEF
DraftKings Week 10 Millionaire Winning Lineup
Most Rostered Players
| Player | Pos | DK Salary | DK Ownership |
|---|---|---|---|
| Tom Brady | QB | $7,600 | 18.0% |
| Dak Prescott | QB | $6,900 | 13.4% |
| Justin Herbert | QB | $7,300 | 12.3% |
| Carson Wentz | QB | $5,900 | 10.0% |
| Josh Allen | QB | $7,900 | 9.7% |
| D'Ernest Johnson | RB | $4,700 | 48.4% |
| Mark Ingram | RB | $4,500 | 26.2% |
| Najee Harris | RB | $7,900 | 26.1% |
| Jonathan Taylor | RB | $8,100 | 20.0% |
| James Conner | RB | $6,300 | 17.1% |
| Mike Evans | WR | $6,900 | 34.0% |
| Michael Pittman Jr. | WR | $6,300 | 24.0% |
| Davante Adams | WR | $7,900 | 23.2% |
| Mike Williams | WR | $6,600 | 17.7% |
| Tyler Johnson | WR | $3,300 | 12.8% |
| Dan Arnold | TE | $3,500 | 17.5% |
| Kyle Pitts | TE | $5,800 | 13.2% |
| Pat Freiermuth | TE | $3,900 | 11.5% |
| Dawson Knox | TE | $4,500 | 10.9% |
| Tyler Conklin | TE | $3,400 | 9.3% |
| Titans | DEF | $2,600 | 22.6% |
| Cardinals | DEF | $3,700 | 8.2% |
| Lions | DEF | $2,300 | 7.7% |
| Bills | DEF | $4,000 | 7.6% |
| Panthers | DEF | $2,400 | 6.7% |
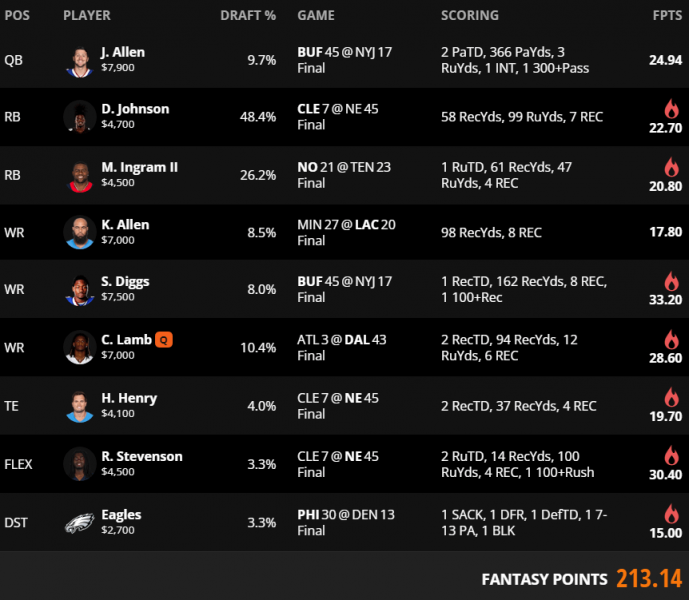
Week 10 was one of the most unique weeks we’ve had in DFS, maybe ever, with two clear-cut free square plays at running back. Given how popular D’Ernest Johnson and Mark Ingram were likely to be, playing them together would require some real creativity to build a unique lineup.
One way that this week’s winner did that was by playing the running back opposite of Johnson, rostering Rhamondre Stevenson after he was announced as active while also adding a tight end to the secondary correlation. Using Stevenson differentiated the lineup by using a third low-salary running back while most lineups were using Johnson and Ingram’s low salaries to pay up for another running back. Over half of the Millionaire field used three running backs, a huge percentage considering that the field usually flexes a running back about 30% of the time.
Naturally, this was the first time all season that a winning lineup rostered three wide receivers priced $7,000 or higher. Interestingly, only one of those wide receivers was correlated with another player in the lineup. For the third time this season, the Millionaire winner used just two players in their primary quarterback stack while only three winners this season have used a pass-catcher on the team playing against their quarterback.
Despite having four roster spots dedicated to players with sub-5% ownership, the 13.5% average ownership of this week’s winning lineup was the highest of the season.
FanDuel Week 10 Sunday Million Winning Lineup
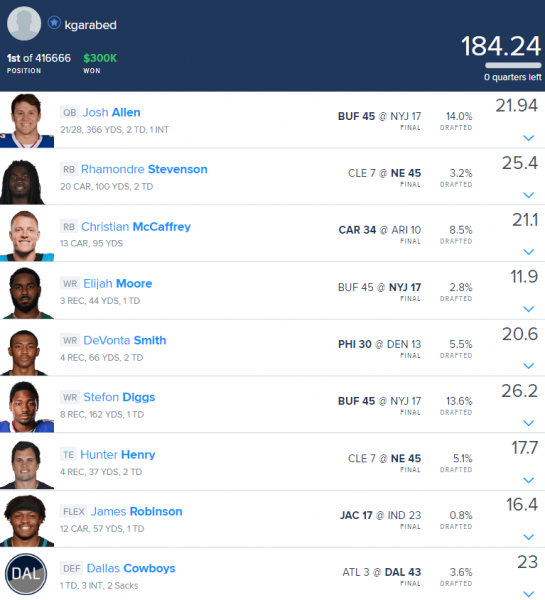
With salaries already typically being loose on FanDuel, the availability of Johnson and Ingram didn’t have quite the impact on the leaderboard that it did on DraftKings. The Week 10 Sunday Million winner took down the tournament without either of the obvious cheap running back plays, instead, pivoting to Stevenson at the same salary as Johnson and paying up for the other two backs.
Having some combination of Stefon Diggs or CeeDee Lamb with one of their quarterbacks was a key to climbing FanDuel leaderboards on Sunday but this week’s winner differentiated with Elijah Moore as a bring-back play.
Even with the chalk Allen/Diggs stack, this was by far the most contrarian lineup to win the Sunday Million this year, carrying an average ownership of just 6.3%. The running back mini-correlation remains ever-present in winning Sunday Million lineups, now showing up on all 10 winning rosters.

TJs Final #Taek
One of our signature metrics at 4for4 is schedule-adjusted fantasy points allowed, a metric that uses a rolling 10-week window. This makes sure the data stays relevant—so much has changed since Week 1 in terms of depth charts, schemes and coaching, that throwing out early-season data is not only acceptable but sometimes necessary. With half of the season behind us, most of my research moving forward will focus on 4–6-week windows, depending on the situation, and sometimes even smaller samples. Like 4for4's schedule-adjusted metric, I always want to look for the most relevant data.
Consider data such as neutral passing rate. Most teams stay true to what they do throughout the season but this is also a metric that can be misleading if only looking at season-long numbers. Even if not misleading, we might miss out on some valuable trends by not considering recent data. The following data shows neutral passing rates for every team over the first five weeks of the season and how the data looks over the last five weeks. Keep these numbers in mind when you inevitably hear any mention of season-long rates moving forward.
| Team | Neutral Pass%, Weeks 1–5 | Neutral Pass%, Weeks 6–10 | Difference |
|---|---|---|---|
| NYJ | 54% | 65% | +11% |
| BUF | 62% | 72% | +10% |
| CIN | 56% | 66% | +10% |
| KC | 55% | 64% | +9% |
| JAC | 51% | 60% | +9% |
| LAR | 59% | 67% | +8% |
| CHI | 44% | 51% | +7% |
| HOU | 53% | 60% | +7% |
| NO | 50% | 56% | +6% |
| CLE | 48% | 54% | +6% |
| DAL | 56% | 62% | +6% |
| BAL | 48% | 53% | +5% |
| SEA | 54% | 59% | +5% |
| TEN | 53% | 57% | +4% |
| LV | 62% | 64% | +2% |
| SF | 52% | 54% | +2% |
| DET | 50% | 51% | +1% |
| WAS | 58% | 58% | +0% |
| DEN | 58% | 58% | +0% |
| MIA | 65% | 64% | -1% |
| ATL | 59% | 58% | -1% |
| PIT | 60% | 59% | -1% |
| ARI | 56% | 55% | -1% |
| IND | 58% | 57% | -1% |
| GB | 58% | 56% | -2% |
| NYG | 60% | 58% | -2% |
| MIN | 61% | 58% | -3% |
| LAC | 64% | 60% | -4% |
| TB | 67% | 63% | -4% |
| CAR | 57% | 48% | -9% |
| NE | 63% | 45% | -18% |
| PHI | 61% | 41% | -20% |


