TJ's #Taek: Week 8 NFL DFS Recap

Week 8’s winning lineups from the biggest contests on FanDuel and DraftKings can be used to tease out lineup-building strategies and offer clues on how you could have landed on a similar team. Reviewing your hits and misses each week is imperative if you want to be a profitable DFS player but examining winning lineups is also a useful exercise in cultivating a winning approach.
DraftKings Week 8 Millionaire Winning Lineup
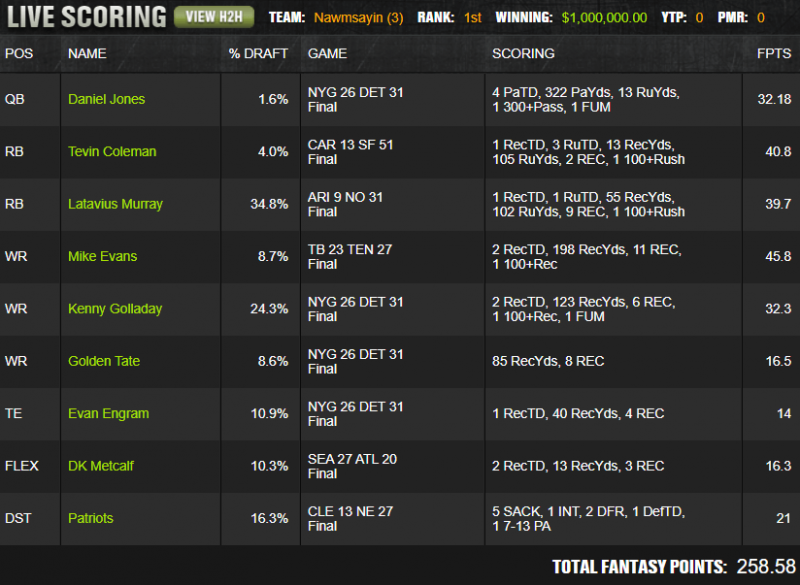
This week’s Millionaire winner applied some standard GPP concepts to best a field of over 200,000. The low-priced value back in a smash spot came through in a big way as the Saints rolled the Cardinals while avoiding the value traps that were Ty Johnson and Chase Edmonds was equally important. As we’ve seen consistently with big tournament winners, heavy correlation came into play here with four players from one game in the winning lineup.
What Were the Indicators for the Low-Owned Plays?
As I mentioned in last week’s Ownership Analysis, there were so many teams in games with high projected scores that at least a couple of relatively obvious shootouts would go under-owned. I was targeting the Lions side of their matchup with the Giants but with two defenses going into the game ranked in the bottom 10 in schedule-adjusted points allowed to quarterbacks, it made sense to look at both sides here. Even if a team isn’t mentioned as an overweight play, the correlation of the offense opposite one that you are targeting should almost always at least be considered. Being on the Giants side led to low ownership and salary savings.
Ty Johnson was among the biggest value traps of the year and Tevin Coleman was almost a perfect price pivot. San Francisco was a big home favorite against a bottom-10 run defense but Coleman went largely ignored, presumably because of the timeshare with Matt Breida. Sure, Coleman hadn’t seen more than 60% of the backfield work since returning from injury but the 49ers run so much that Coleman came into the week with three consecutive games of at least 16 touches and back-to-back 20-touch games.
Tampa Bay’s offense has a couple of things going for them every week. Their defense can turn any game into a high-scoring affair and when the Buccaneers do throw, they have one of the most concentrated target shares in the league. Mike Evans and Chris Godwin always have double-digit target upside in this offense and Evans’s 15.1-yard average depth of target makes him liable to explode in any matchup.
FanDuel Week 8 Sunday Million Winning Lineup
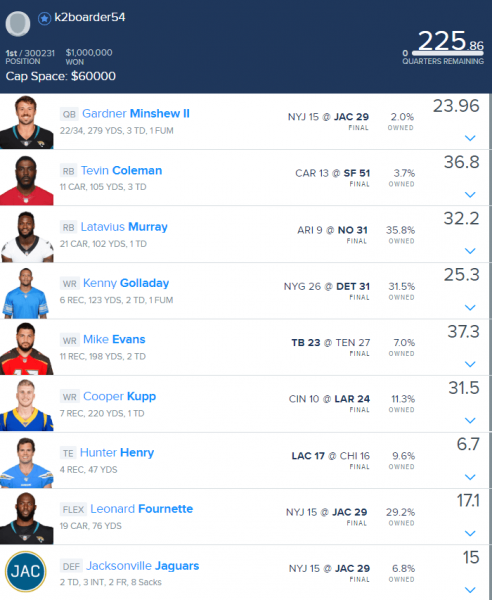
This week’s Sunday Million winner implemented the untraditional QB/RB/DEF stack to help offset a relatively chalky lineup. By rostering a quarterback with his running back, you give yourself a chance to corner almost all of one offense’s production and this tactic works especially well when a team has a somewhat diluted target share. Going into the week, four Jaguars had seen at least 15% of the team targets, making it worth the risk to start Gardner Minshew without one of his primary receivers. While Minshew didn’t have a monster game, he finished as the QB6, less than five points behind the week’s QB1. Because fantasy scoring is usually quite flat at the quarterback position, it often pays to be contrarian there.
TJ’s Final #Taek
One of the best ways to find hidden upside is to look for players with underrated scoring opportunities. Often, these players have had chances to get it in the end zone but just haven’t converted those touches or targets into scores. While red zone volume can be an indicator of scoring opportunity, all red zone looks aren’t created equal—a target from the 19, for example, doesn’t have the same scoring expectation as a target from inside the 5-yard line.
To account for this, I created a metric called Red Zone Expected Value. In short, I look at every play that takes place inside the red zone and use historical scoring rates from every yard line to calculate a scoring expectation, adjusting for position and type of opportunity (pass, target or rush). For a more in-depth explanation, you can read up on the full methodology here. Having an idea of players who may be due for some positive touchdown regression can help us find underperforming players who will often be low-owned in DFS. These players shouldn’t blindly be weekly DFS targets but in the right spot, this information can be a tournament-winner.
The following players have scored the fewest points below their red zone expectation through the first eight weeks.
Quarterback
| Player | Expected Red Zone TDs | Actual Red Zone TDs |
|---|---|---|
| Andy Dalton | 11.3 | 5 |
| Baker Mayfield | 8.0 | 3 |
| Kyler Murray | 10.2 | 6 |
| Tom Brady | 11.7 | 8 |
Running Back
| Player | Expected Red Zone TDs | Actual Red Zone TDs |
|---|---|---|
| Leonard Fournette | 4.3 | 1 |
| Gus Edwards | 3.0 | 0 |
| Miles Sanders | 1.9 | 0 |
| Kerryon Johnson | 3.9 | 2 |
| Joe Mixon | 4.7 | 3 |
| Chris Thompson | 1.7 | 0 |
Wide Receiver
| Player | Expected Red Zone TDs | Actual Red Zone TDs |
|---|---|---|
| Mike Williams | 2.7 | 0 |
| Auden Tate | 3.6 | 1 |
| Jarvis Landry | 2.2 | 0 |
Tight End
| Player | Expected Red Zone TDs | Actual Red Zone TDs |
|---|---|---|
| Travis Kelce | 3.3 | 0 |
| George Kittle | 1.4 | 0 |
| T.J. Hockenson | 2.2 | 1 |
| Tyler Eifert | 2.1 | 1 |

