Weather Effects and Fantasy Football, Part 2

“Volume is king.”
Every fluke-y touchdown reception. Every 75-yard run to the house. Even the short screen pass that goes for zero yards. It all traces back to volume. The ‘size of the pie’ that’s a critical component to both seasonal and weekly projections. But here, we’re focused on the passing game. Quarterback play and subsequent pass attempts (volume) are the primary lifelines for all PPR assets. It’s the mainstay for WR fantasy production and buoys the elite RBs. Much of what we know with regards to the relationship between passing and rushing is based on testable hypotheses and historical data. However, one thing remains irrefutable: Once the passing game breaks down the entire fantasy landscape changes.
The first part in this weather series looked at league-wide trends. Or, essentially, analyzed a testable theory: Is the passing game impacted by poor weather? The data set did not support the null hypothesis and multiple aspects of the game indicated an impact due to weather (e.g. Vegas projections, Air Yards, positional distribution). Unless the WR has high efficiency, the drop in volume will decrease their fantasy output.
| Player (Team) | Targets | Catch% |
|---|---|---|
|
Golden Tate (DET) |
120 |
76.7% |
|
Tyreek Hill (KC) |
105 |
71.4% |
|
Michael Thomas (NO) |
149 |
69.8% |
|
Jarvis Landry (CLE) |
161 |
69.6% |
|
Larry Fitzgerald (ARI) |
161 |
67.7% |
|
Doug Baldwin (SEA) |
116 |
64.7% |
|
Keenan Allen (LAC) |
159 |
64.2% |
|
Jamison Crowder (WAS) |
103 |
64.1% |
|
Jermaine Kearse (NYJ) |
102 |
63.7% |
|
Adam Thielen (MIN) |
143 |
63.6% |
|
Davante Adams (GB) |
118 |
62.7% |
|
Antonio Brown (PIT) |
162 |
62.3% |
Safety is the word that comes to mind when looking at the above table. Volume begets production, but the ability to convert opportunity into production (i.e. efficiency) is a skill on its own. Data collected in the first part of this series showed an average 2.59 percent drop in pass attempts across the three conditions studied. The ‘pie’ has shrunk, reducing the output of every usable player. This makes deploying an asset with poor efficiency but high upside a tough proposition under poor conditions.
But, here’s the thing about averages. It’s just one number meant to tell the story about an entire data set. Regardless of how elements being analyzed, central tendencies don’t provide context. Maximum. Minimum. The extremes are where we can find actionable information and begin to make logical reasonings on what’s being observed.
This second part in the series looks to identify specific teams and their quarterbacks whose volume is affected either positively or negatively. With each, the following questions will be answered:
- Was there a discernible pattern in the drop or increase in volume?
- Was the game home or away?
- Was it an in-division or out-of-division opponent?
- Who was the primary beneficiary?
- Were certain player archetypes favored (e.g. slot receivers, satellite backs)? 1
- How does target distribution shift for these offenses across RB/WR/TE?
Each quarterback offers their own narratives to be included, but the overarching objectives remain. First, identify the quarterbacks who are the most severely affected by poor weather conditions. From there, determine how their surrounding talent was affected to derive any patterns.
Quarterbacks/Teams Affected
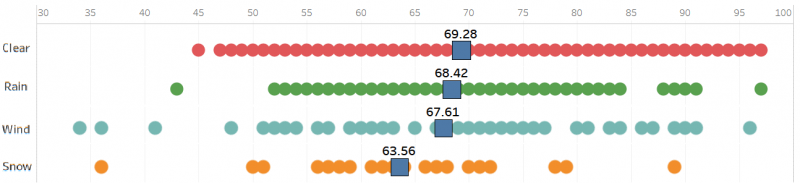
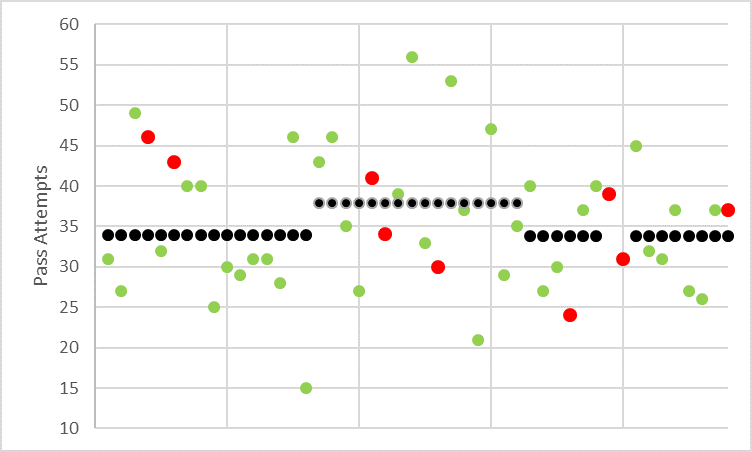
An earlier version of the study focused on high wind conditions only. Every active quarterback with at least three full seasons as a starter was included. The comparisons of extreme conditions (15+MPH) to baseline (0-4 MPH) give us the teams to delve into further.
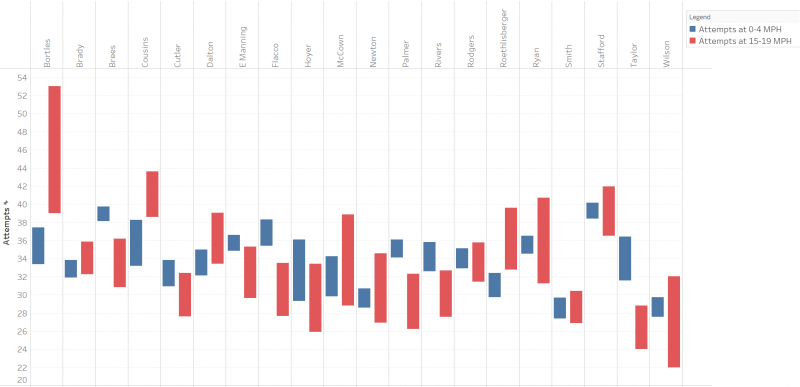
While most hover around their average, despite extreme winds, at least four showed an exaggerated shift. Blake Bortles and Kirk Cousins saw significant increases in their average attempts (29.9% and 12.9%, respectively) while Drew Brees and Philip Rivers saw significant decreases (13.9% and 11.9%, respectively). With the additional data and understanding of snow and rain impacting games, the population was expanded. From here, the study continues.
The Bad – Saints/Chargers
Drew Brees
Drew Brees appearing on the list was surprising. He plays in a dome. The number of games with poor weather conditions should almost assuredly be small. It would add ammo to ‘Home/Away Split’ narratives, but a key element to Brees’ career was overlooked. He was originally drafted by the San Diego Chargers. This helped explain much of what can be seen in the data.
Other dome quarterbacks (e.g. Stafford, Ryan) were minimally affected with a maximum 1.4 percent increase in attempts. Brees’ 13.9 percent reduction becomes understandable when looking over his full career. Of the 17 total games played under poor conditions, nine of them occurred within his first four years in San Diego. The remaining seven are spread out over the next 12 years. This bodes well for Brees’ outlook in future bad weather games.
The key difference is the personnel. From 2002 to 2004, the Chargers ranked 21st, 12th and 28th in pass attempts. LaDainian Tomlinson was the centerpiece of the offense with receivers such as Curtis Conway, David Boston and Eric Parker to back him up on the outside. This is a stark contrast to Marques Colston (2009-2012), Brandin Cooks (2015-2016) and Michael Thomas. However, it is noteworthy that over the last four seasons all of his poor weather games have resulted in pass attempts below his seasonal average. If there was any declination with respect to age, poor weather could be a partial explanation for this behavior.
Philip Rivers
After taking over for Brees, Philip Rivers-led offenses have featured much more prominent players. Vincent Jackson, Malcom Floyd and Antonio Gates were key personnel during Rivers’ start in the league with Keenan Allen and Melvin Gordon leading him to his retirement. But still, he’s had lopsided performances under adverse weather conditions.
A strong division was initially considered for Rivers’ 11.9 percent drop compared to baseline conditions. While mostly anecdotal, divisional games have shown to produce a dip in quarterback production. Since 2009, the AFC West has featured at least one top top-20 defense with Denver and Kansas City leaping to the top five in 2015 and 2016. However, in-division opponents only accounted for 28 percent of Rivers’ poor weather games.
But, on a positive note, the loss in personnel didn’t adversely affect Rivers’ output. The Chargers have been hamstrung by injuries to key players the last three seasons. However, Rivers has gone above his seasonal average for pass attempts in every game during this time period.
The Good – Jaguars/Redskins (Vikings)
Blake Bortles
Bortles' 29.9 percent increase in pass attempts under poor conditions was the greatest increase for a starting quarterback. But here, the study has fallen prey to small sample sizes. In 61 starts, Bortles has only played in four bad weather games. This is what causes the large error bounds, putting the analysis on shaky ground. However, there are some team trends that provide some context for the findings.
The two games where Bortles threw above his seasonal average (vs. HOU Week 12, 2014, vs. HOU Week 6, 2015) were during the 2014–2016 seasons. In this time, Bortles ranked 17th, sixth and third in pass attempts. His penchant for putting the Jaguars behind early due to interceptions and digging them out with increased volume. In 2014, 74.9 percent of Bortles’ passes came while the team was behind. That same metric was 70.6 percent in 2015 and 65.9 percent in 2016.
In 2017? It was 42.2 percent.
The offensive shift to a more emphasized running game resulted in over 100 fewer attempts than the previous season. This should be a greater concern to drafters than the weather.
Kirk Cousins
Cousins moving to Minnesota might make his past trends irrelevant, but the system he's coming into should keep this relevant. However, again, the study falls prey to small samples. Cousins' 12.9 percent increase in attempts is buoyed by two games well above his seasonal average. With only three total games under poor weather conditions, it’s difficult to extrapolate any meaningful conclusions.
Expanding the study to include both rain and snow accomplishes two objectives. It adds more data to the sample boosting its legitimacy and, more importantly, changes the perception of Cousins in bad weather games. Cousins’ average attempts in poor weather games drops to 36.1, making this only a 1.1 percent increase versus the 12.9 percent. But, on a positive note, this does place him on the positive side of variance and his new home—U.S. Bank Stadium—should keep him away from bad weather in most situations.
How Does This Affect the Offense?
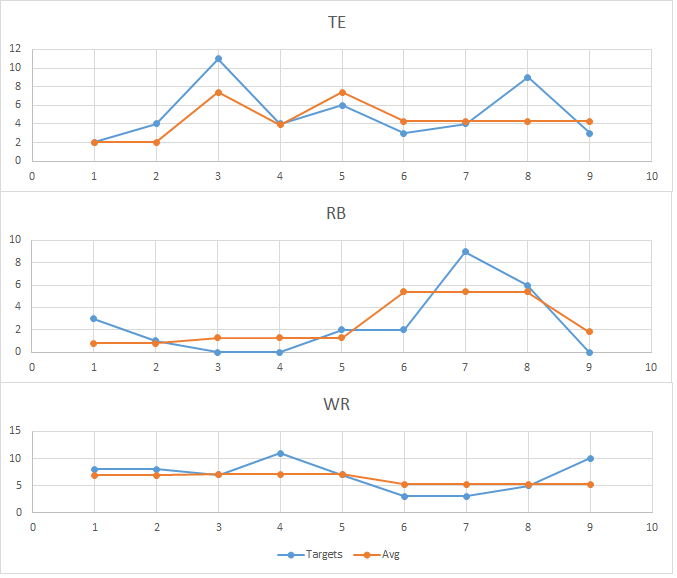
With an understanding of the quarterbacks, the next task is to see if the observed changes flow down to the receivers. Personnel changes over time. To account for this, player archetype and usage (e.g. routes run out of the slot or out wide) were considered. For brevity, only the primary player at the position was considered (the most-targeted pass-catcher).
Drew Brees
Running backs saw the highest number of occurrences where the targets were less than the player’s seasonal average (12 games). Even with the likes of LaDainian Tomlinson and Deuce McAllister toting the rock, their targets decreased by an average of 40.3 percent. Wide receivers were the least impacted, with tight ends similarly affected. It helps to throw to Marques Colston and Jimmy Graham in their primes.
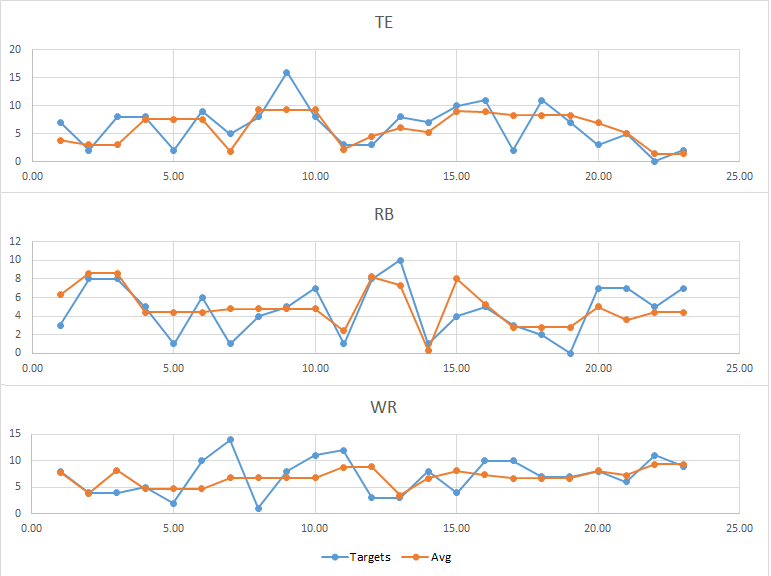
Remember the point made in Brees’ overview: Most of his poor weather conditions came while in San Diego. The ascension of 'Boom and Zoom' clearly showed Brees’ reliance on the position in all situations. This positive trend is shown in the last four data points of the RB plot.
Philip Rivers
Rivers’ data shows similar behavior. Running backs saw an average 47.4 percent target reduction in poor weather games (13). By contrast, receivers saw an average 41.1 percent increase in targets (7). Tight ends were slightly more affected than receivers, but it was Antonio Gates doing most of the production (he was the primary tight end in 10 out of 12 seasons with Rivers).
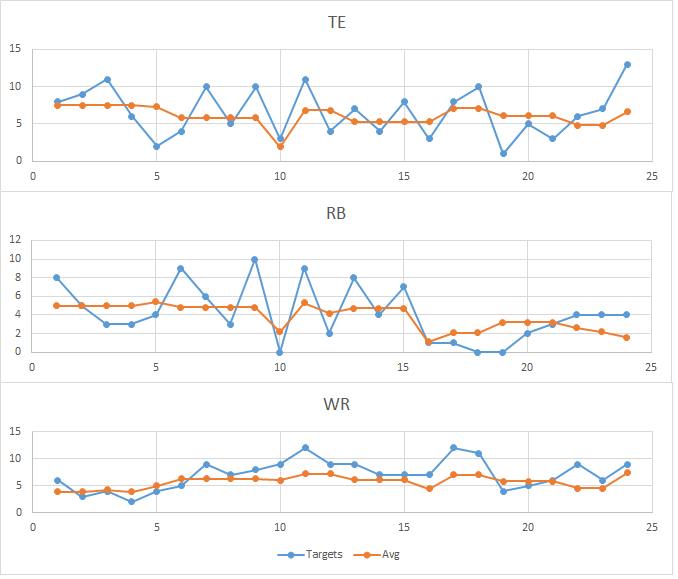
The running back production, or lack thereof, was surprising. But, an important element was missing. San Diego has featured change-of-pace RBs throughout most of Rivers’ tenure. Darren Sproles and Danny Woodhead complemented the primary running back in their abilities as pass-catchers. Their targets remained stable against their seasonal average. Austin Ekeler has shown himself to be a viable receiving threat out of the backfield. Assuming he continues to carve out a role, his role in poor weather conditions should be monitored.
Blake Bortles
It’s no surprise, but Bortles leaned on his receivers regardless of the weather. Only one game resulted in a target drop for the primary receiver. Cecil Shorts played primarily on the outside (only 4.5% of routes run out of the slot). Allen Robinson showed similar usage (18.5% and 11.4% routes run from the slot). Marqise Lee currently projects to be the primary receiver in Robinson’s absence. If the role is secured, his targets should be as well.
The lack of tight end usage is concerning. However, the number one option at the position was 33-year-old Marcedes Lewis. Acquiring Austin Seferian-Jenkins is a situation worth monitoring. He ran 59.4 percent of his routes out of the slot in 2017. At 6-foot-5, he becomes the largest target on the field and is only 25 years old. If the athleticism is still there, there’s value to be exploited here.
Kirk Cousins
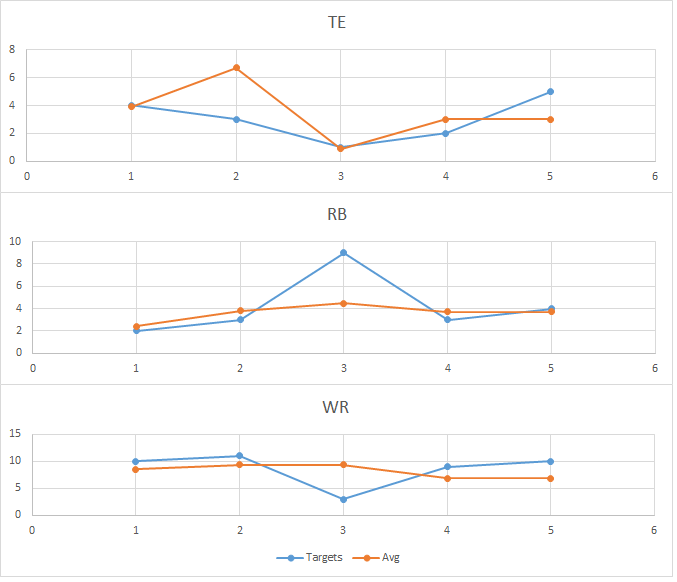
Data matters, but data with context matters more. The plots indicate a lack of WR and RB targets while tight ends have either an equal or greater number of targets. But identifying the personnel provides the necessary context. Washington’s most productive receivers over the last three seasons have been Pierre Garcon and Josh Doctson. Their primary running backs (Alfred Morris, Rob Kelley and Samaje Perine) have combined for 55 targets over three seasons and incorporated a satellite back. Plus, the combination of Jordan Reed and Vernon Davis have remained in the top 10 with respect to yardage at the tight end position each season Cousins has been the starter. With this cast, it properly frames the data and provides a more logical starting point for Cousins' future in Minnesota.
Kirk Cousins' average depth of target (aDOT) was 8.0 during the 2017 season. In the four poor weather games he played during the same seasons, his aDOT was 4.6, 14.3, 3.6 and 4.1. Doctson’s aDOT was 13.8, as indicated by his exclusive usage on the outside. However, both Reed and Davis had smaller aDOT numbers (10.8 and 6.4, respectively) based on their routes run from the slot, boosting their workload in these conditions. Regardless of who’s considered the primary receiver for the Vikings, both Stefon Diggs and Adam Thielen have worked out of the slot. On top of playing in a dome, weather concerns should have minimal impact on Cousins moving forward.
Takeaways
League level trends can be flowed down to the primary receiving personnel, but context must be supplied to make the information actionable. Sample size is also an issue when processing data of this type, both from a volume and granularity standpoint. For quarterbacks who have only started a few seasons, the sample must be properly analyzed with an understanding of the team dynamics to come away with logical conclusions. The players involved and how they’re used will be a large factor in determining if they’ll be viable fantasy starters on game day.
Photo by Brett Carlsen/Getty Images.
1. Route data was unavailable for inclusion into the study at this time. Only assumptions based on season-long data was used for these purposes. Adjustments will be made when the appropriate data can be accessed.
Related Articles