TJ's #Taek: Mid-Season NFL DFS GPP Recap

Now that we are officially past the halfway point in the season, this week’s article format will be a bit different, offering a zoomed-out view of what has worked in large-field tournaments up to this point. This will mostly serve as a recap of the review articles and a reset to our process to make sure that the trends that we are following are the ones that are most relevant to the current DFS climate.
Scroll to the end of the article for an overview of ownership, salary allocation and stacks used in winning Millionaire and Sunday Million lineups.
More GPP Strategy: QB | RB | WR | TE | DEF
2021 GPP Trends Recap
Ownership is Flatter Than Ever
There have only been eight players all season in at least 30% of Millionaire lineups. No player has hit 40% ownership and there have been three weeks where no player reached 30%. There are probably a couple of reasons for this—salaries have been generally sharp and the average DFS player is getting better, understanding that they should be contrarian when possible.
Flat ownership means that ownership projections are going to be fragile. Much like we do with point projections, we should consider that fragility when building lineups. This can mean being more willing than usual to roster players that might project for relatively high ownership if we rate them a lot higher than the field since they may not come in as popular as we expected. On the other side, players that might be in our player pool simply to be contrarian may not be as unpopular as we thought. Instead, look for players that offer maximum leverage to ensure that they offer tournament value (more on that shortly).
The low ownership ceiling means that we can roster the most popular players more often than in previous seasons since it will be easy to lower the average ownership of our lineups—the sweet spot in large-field tournaments is usually somewhere between 10% and 15% average ownership, about a 135% maximum cumulative ownership.
Maximize Your Leverage Opportunities
This concept is one that is tied to the previous trend but should probably be considered all the time. In GPPs, we aren’t just trying to be unique but we are trying to gain leverage with our contrarian plays—this can be accomplished with leverage off of a popular player or offense, with a price pivot, or by using a contrarian salary allocation. Ideally, our leverage plays will accomplish more than one of these, especially when there aren’t any players drawing massive ownership.
The Art of the Bring Back
As the game of DFS has evolved, the idea of game stacks—rostering players from both teams in the same game—has grown in popularity. While it makes sense to try to capture as many points as possible in the highest-scoring games, using a bring-back shouldn’t be automatic. Of the nine DraftKings Millionaire winners this season, four have used a bring back; only two FanDuel Sunday Million winners have used a player on the team playing against their quarterback.
Many times, offenses that offer tournament-winning upside dominate in a fashion that their opponents find themselves in a game script that allows the winning defense to tee off. The losing team can gain fantasy value through volume rather than touchdowns, which might explain why the bring-back is more prevalent on DraftKings than on FanDuel.
Rather than always using a game stack, tournament players should consider adding mini-correlations to their lineups in addition to their primary quarterback stack.
Running Back Mini-Stacks
Maybe the most glaring trend in top tournament lineups this season has been the proliferation of mini-stacks with a running back. Five of this year’s Millionaire winners have used a mini-stack with a running back and every single Sunday Million winner has done so.
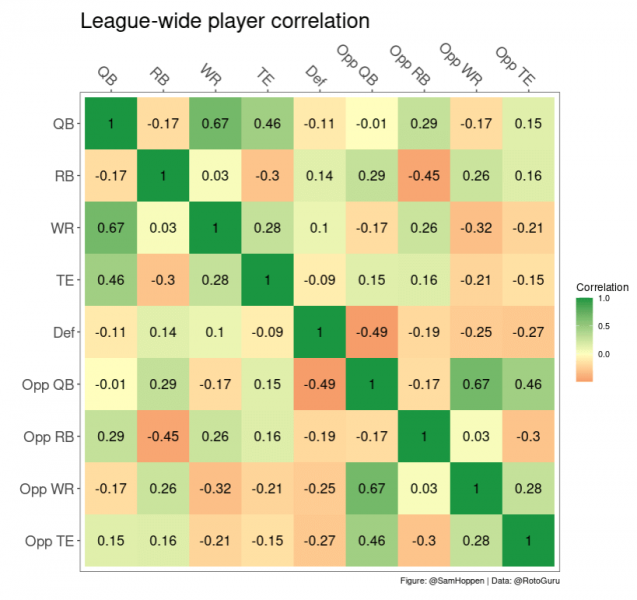
Using the 4for4 DFS Correlation Tool, filtering for games with an over/under of at least 50 and teams that are favored by three or more on FanDuel (games that we are usually targeting in GPPs), we see that running backs actually correlate more with the opposing passing game than quarterbacks.
Are We Overvaluing Rushing QBs (on DraftKings)?
There have been 24 instances of a quarterback in at least 10% of Millionaire lineups this season—12 of those instances have been rushing quarterbacks (Josh Allen, Lamar Jackson, Jalen Hurts, Kyler Murray, Daniel Jones, Taylor Heinicke). Murray, Hurts and Trey Lance also make up the other four instances of quarterbacks with at least 9% ownership. Allen is the only one to show up in a winning Millionaire lineup and he only ran for 9 yards that day.
Quarterbacks in winning DraftKings Millionaire lineups have averaged 10.7 rushing yards while those in winning FanDuel Sunday Million lineups have averaged almost 34 rushing yards. The 300-yard bonus on DraftKings evens the field between mobile and non-mobile passers and might even give the edge to quarterbacks with 300/3 passing upside. On FanDuel, quarterbacks that run can make up for a lack of yardage.
This isn’t to say that players like Josh Allen and Lamar Jackson shouldn’t be used in DraftKings GPPs but it should be when they have huge passing upside, not just because they can run.
Using Tight Ends in the Flex
There has been an increase in teams that are opting for two-tight-end builds this year, especially on DraftKings (it may be on FanDuel as well but full contest CSVs are not available). About 20% of Millionaire lineups have flexed a tight end. Regardless of the reason for this recent phenomenon—it might have to do with the lack of viable punt plays—it is probably being overused. While the field is using two tight ends about a fifth of the time, top tournament lineups are flexing a tight end at a notably lower late, electing to use four wide receivers more often.
It isn’t egregious to use two tight ends in even the largest field, but it should usually only be used to add correlation to a lineup or to offset high ownership on one of the tight ends.
Winning DraftKings Millionaire Roster Construction
Salary Allocation
| Week | QB | RB1 | RB2 | WR1 | WR2 | WR3 | TE | Flex | Flex Pos | DEF | Total |
|---|---|---|---|---|---|---|---|---|---|---|---|
| 1 | $5,700 | $6,200 | $5,300 | $8,200 | $5,900 | $4,700 | $8,300 | $3,600 | WR | $2,100 | $50,000 |
| 2 | $6,900 | $8,300 | $5,100 | $7,200 | $6,000 | $4,700 | $4,700 | $4,000 | WR | $2,900 | $49,800 |
| 3 | $7,000 | $6,000 | $5,800 | $7,300 | $7,200 | $4,800 | $4,700 | $4,200 | WR | $3,000 | $50,000 |
| 4 | $6,700 | $6,700 | $5,800 | $6,600 | $6,500 | $5,000 | $3,400 | $4,900 | RB | $4,300 | $49,900 |
| 5 | $7,400 | $6,000 | $5,500 | $8,200 | $6,800 | $5,200 | $3,700 | $4,000 | WR | $3,000 | $49,800 |
| 6 | $5,900 | $6,600 | $6,400 | $6,500 | $5,800 | $3,500 | $7,000 | $4,800 | TE | $3,500 | $50,000 |
| 7 | $7,100 | $6,000 | $5,700 | $8,400 | $6,900 | $5,900 | $2,500 | $3,500 | WR | $4,000 | $50,000 |
| 8 | $5,700 | $5,400 | $4,900 | $9,000 | $6,900 | $6,400 | $3,600 | $5,300 | WR | $2,800 | $50,000 |
| 9 | $7,000 | $6,700 | $5,300 | $6,700 | $6,000 | $5,600 | $4,900 | $5,300 | RB | $2,500 | $50,000 |
| AVG | $6,600 | $6,433 | $5,533 | $7,567 | $6,444 | $5,089 | $4,756 | $4,400 | $3,122 | $49,944 |
Ownership*
| Week | QB | RB1 | RB2 | WR1 | WR2 | WR3 | TE | Flex | Flex Pos | DEF | Average |
|---|---|---|---|---|---|---|---|---|---|---|---|
| 1 | 3.0% | 12.9% | 3.9% | 13.7% | 12.6% | 11.3% | 14.4% | 5.0% | WR | 1.3% | 8.7% |
| 2 | 13.4% | 7.0% | 4.8% | 20.3% | 8.6% | 4.7% | 17.8% | 2.4% | WR | 8.9% | 9.8% |
| 3 | 5.4% | 14.8% | 6.3% | 13.6% | 6.7% | 4.2% | 1.2% | 3.3% | WR | 16.8% | 8.0% |
| 4 | 6.8% | 20.2% | 6.7% | 17.7% | 10.1% | 9.9% | 9.6% | 2.5% | RB | 5.6% | 9.9% |
| 5 | 6.4% | 35.4% | 6.4% | 23.6% | 14.7% | 11.3% | 4.5% | 5.4% | WR | 8.1% | 12.9% |
| 6 | 1.7% | 25.1% | 15.0% | 5.6% | 5.3% | 0.8% | 21.9% | 2.7% | TE | 14.9% | 10.3% |
| 7 | 13.4% | 12.6% | 7.0% | 25.9% | 19.3% | 4.3% | 2.0% | 4.1% | WR | 2.8% | 10.2% |
| 8 | 8.0% | 11.0% | 6.0% | 26.4% | 24.6% | 14.6% | 4.5% | 14.5% | WR | 5.1% | 12.7% |
| 9 | 3.5% | 21.1% | 8.1% | 28.3% | 14.2% | 7.0% | 15.7% | 2.0% | RB | 3.0% | 11.4% |
| AVG | 6.8% | 17.8% | 7.1% | 19.5% | 12.9% | 7.6% | 10.2% | 4.7% | 7.4% | 10.4% |
*Note that designations such as RB1 and WR1 in this section refer to the highest-priced or highest-owned player at the position on each roster. Consequently, the RB1 in terms of salary may not necessarily match up with the RB1 in terms of ownership above.
Stacks Used
| Week | Primary Stack | Secondary Stack | Third Stack | Correlated Players |
|---|---|---|---|---|
| 1 | QB/WR/RB | WR/TE | 5 | |
| 2 | QB/RB/TE | RB/Opp WR | WR/DEF | 7 |
| 3 | QB/WR/WR/Opp TE | RB/WR/Opp WR | 7 | |
| 4 | QB/TE/Opp WR | 3 | ||
| 5 | QB/WR/WR | RB/DEF | 5 | |
| 6 | QB/WR | RB/DEF | 4 | |
| 7 | QB/WR/WR/Opp RB | WR/DEF | 6 | |
| 8 | QB/WR/Opp WR | 3 | ||
| 9 | QB/WR | RB/DEF | WR/TE | 6 |
Winning FanDuel Sunday Million Roster Construction
Salary Allocation
| Week | QB | RB1 | RB2 | WR1 | WR2 | WR3 | TE | Flex | Flex Pos | DEF | Total |
|---|---|---|---|---|---|---|---|---|---|---|---|
| 1 | $8,800 | $7,200 | $6,400 | $8,500 | $7,900 | $6,300 | $5,700 | $5,800 | WR | $3,400 | $60,000 |
| 2 | $8,700 | $8,000 | $7,000 | $7,200 | $6,200 | $4,900 | $5,500 | $6,100 | RB | $3,700 | $57,300 |
| 3 | $7,500 | $7,000 | $5,200 | $7,900 | $7,400 | $6,000 | $8,500 | $5,900 | WR | $4,600 | $60,000 |
| 4 | $8,700 | $6,900 | $6,400 | $8,200 | $6,900 | $6,000 | $6,000 | $5,900 | WR | $5,000 | $60,000 |
| 5 | $7,700 | $7,700 | $5,600 | $8,200 | $7,700 | $7,000 | $5,400 | $6,500 | WR | $4,000 | $59,800 |
| 6 | $8,100 | $7,500 | $7,300 | $8,200 | $7,200 | $7,000 | $5,000 | $5,500 | RB | $4,100 | $59,900 |
| 7 | $7,200 | $7,200 | $6,800 | $8,800 | $7,500 | $7,100 | $5,700 | $5,200 | TE | $4,400 | $59,900 |
| 8 | $8,800 | $7,600 | $5,700 | $7,600 | $7,200 | $6,900 | $5,900 | $6,100 | WR | $4,100 | $59,900 |
| 9 | $8,300 | $7,600 | $7,400 | $7,700 | $7,600 | $6,100 | $4,400 | $6,100 | RB | $4,800 | $60,000 |
| AVG | $8,200 | $7,411 | $6,422 | $8,033 | $7,289 | $6,367 | $5,789 | $5,900 | $4,233 | $59,644 |
Ownership*
| Week | QB | RB1 | RB2 | WR1 | WR2 | WR3 | TE | Flex | Flex Pos | DEF | Average |
|---|---|---|---|---|---|---|---|---|---|---|---|
| 1 | 12.5% | 11.2% | 1.6% | 15.4% | 14.8% | 8.0% | 3.9% | 5.2% | WR | 2.6% | 8.4% |
| 2 | 12.9% | 26.3% | 15.5% | 24.6% | 16.0% | 1.1% | 7.8% | 12.6% | RB | 7.1% | 13.8% |
| 3 | 6.4% | 32.6% | 19.6% | 30.2% | 17.7% | 11.0% | 19.8% | 8.7% | WR | 9.1% | 17.2% |
| 4 | 11.5% | 10.2% | 5.6% | 14.5% | 14.2% | 12.6% | 2.3% | 3.4% | WR | 12.3% | 9.6% |
| 5 | 3.6% | 12.7% | 4.1% | 33.0% | 11.3% | 9.5% | 3.8% | 3.9% | WR | 6.9% | 9.9% |
| 6 | 4.1% | 29.9% | 22.4% | 23.5% | 8.8% | 2.8% | 12.4% | 16.4% | RB | 16.2% | 15.2% |
| 7 | 3.0% | 11.4% | 9.4% | 21.0% | 11.5% | 10.3% | 5.7% | 3.3% | TE | 13.6% | 9.9% |
| 8 | 20.6% | 23.3% | 4.5% | 17.4% | 12.8% | 11.9% | 10.3% | 8.6% | WR | 3.3% | 12.5% |
| 9 | 16.1% | 22.7% | 11.9% | 26.7% | 21.4% | 14.2% | 0.2% | 3.8% | RB | 5.1% | 13.6% |
| AVG | 10.1% | 20.0% | 10.5% | 22.9% | 14.3% | 9.0% | 7.4% | 7.3% | 8.5% | 12.2% |
*Note that designations such as RB1 and WR1 in this section refer to the highest-priced or highest-owned player at the position on each roster. Consequently, the RB1 in terms of salary may not necessarily match up with the RB1 in terms of ownership above.
Stacks Used
| Week | Primary Stack | Secondary Stack | Third Stack | Correlated Players |
|---|---|---|---|---|
| 1 | QB/WR | RB/TE/Opp WR | 5 | |
| 2 | QB/WR | RB/Opp WR | 4 | |
| 3 | QB/RB/WR/Opp TE | RB/WR | 6 | |
| 4 | QB/WR/Opp TE | RB/WR | 5 | |
| 5 | QB/RB/WR | RB/DEF | WR/WR | 7 |
| 6 | QB/WR/DEF | RB/WR | 5 | |
| 7 | QB/RB/WR/TE | RB/TE | WR/DEF | 8 |
| 8 | QB/WR | RB/Opp RB | 4 | |
| 9 | QB/WR | RB/Opp RB | 4 |


