Rushing Expectation 2017: An Introduction

One of the toughest things to do in fantasy football is balance metrics with film evaluation.
Rushing Expectation is my attempt to find that perfect balance for the running back position.
Now entering year two of the Rushing Expectation methodology, the clear focal point of my contribution to the industry, I couldn’t be more excited to partner with 4for4 Football. My goal has always been to provide the reader with information from both my charting process and signature metrics in a clear, concise, and actionable manner. To help bridge the gap, I believe that transparency and consistency are extremely important. This is especially true with a unique series.
The following guide will provide you with an introduction to the Rushing Expectation methodology, highlight some exciting new improvements, and give you an idea of what to expect in 2017.
Still not a 4for4 subscriber? Sign up now for 4for4's Classic, Pro, or DFS subscription.
Rushing Expectation Signature Metrics
Most of you are familiar with yards per carry. The problem with using yards per carry in our analysis is it does not show the rate at which a running back is successful. Big plays and short-yardage situations can skew yards per carry, limiting its use both as a predictive metric of future success, as well as an explanatory metric of past performance.
Success Rate: A Better Alternative to Yards per Carry
This leads us to my favorite stat, Success Rate (SR), which is representative of consistency of success relative to down, distance, and situation. Per Football Outsiders, a run is considered a success if it satisfies the following benchmarks:
-
Gains 40% of yards needed on first down, 60% of yards needed on second down, or 100% of yards needed on third down
-
If the offense is behind by more than a touchdown in the fourth quarter, the first/second/third down benchmarks change to 50%/65%/100%, respectively.
-
If the offense is ahead by any amount in the fourth quarter, the first/second/third down benchmarks change to 30%/50%/100%, respectively.
The separation of offensive line play from the back running behind it is not easy to quantify. Clearly, not all offensive lines are created equal.
Is it possible that a great offensive line is making a poor running back look mediocre? Or that a great runner is being held back by a shaky offensive line?
What if there was a way to quantify an expected success rate for each running back based on his team's offensive line play?
From there we could find out if a running back is performing above or below expectation relative to his offensive line.
If this idea intrigues you, I have great news. The signature metric for this methodology allows us to do just that.
I call it Expected Success Rate (eSR).
Expected Success Rate: How Good Is a Running Back's Blocking?
Expected Success Rate is a phenomenal metric that measures how successful a running back should have been based on the performance of his team's blocking.
We can calculate Expected Success Rate for both a running back's rushing attempts and his receiving targets.
Calculating Rushing Expected Success Rate
1. The first step in calculating Expected Success Rate is to determine team Success Rates. For rushing attempts, team Success Rate was calculated by applying the success rate benchmarks mentioned in the previous section to play-by-play data for running back rushing attempts in each season dating back to 2000 (a sample size of nearly 750,000 plays, which will be important for the next step). To be as specific as possible, all rushing attempts were also broken down by direction.
2. Next, I ran a regression on Team Success Rate and Adjusted Line Yards, a metric that assigns a certain amount of responsibility to the offensive line for every rush based on the length of that rush (for instance, the offensive line is given most of the responsibility on short runs close to the line of scrimmage, but doesn't get as much credit for yardage gained by the running back farther downfield).
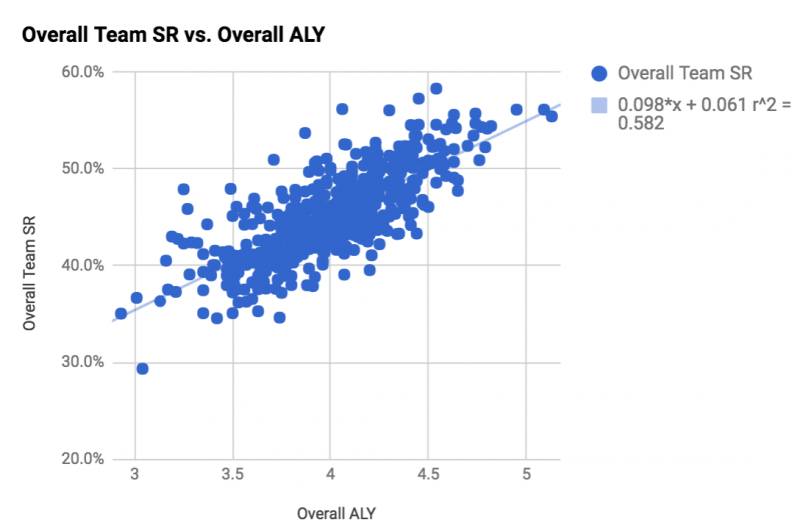
The resulting linear equation is an Expected Success Rate for rushing attempts for each individual team.
Calculating Receiving Expected Success Rate
1. Like rushing Expected Success Rate, the first step in calculating receiving Expected Success Rate is to determine each team's Success Rate, this time on targets to running backs. Again, play-by-play data for each season dating back to 2000 was used, and targets were broken down by direction.
2. To account for blocking on a running back's receiving plays, I have created a metric called Adjusted Reception Yards, which assigns different degrees of responsibility to pass catchers versus blockers depending on how far down the field a play gets, in similar fashion to Adjusted Line Yards. Adjusted Reception Yards is also adjusted for down, distance, and opponent. As with rushing Expected Success Rate, I ran a regression on Team Success Rate and Adjusted Receiving Yards to calculate Receiving Expected Success Rate.
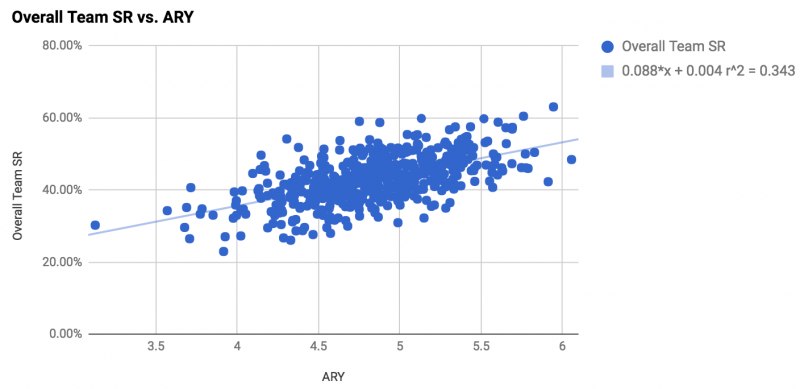
Now we have a second linear equation, this one of the Expected Success Rate for a running back's targets for every individual team.
Chart 1: Sample Size
Sample size and opportunity are two crucial elements of fantasy football. That means in addition to knowing how well a running back has performed relative to Expected Success Rate, we also need to know how large of a sample size that performance encompassed. To that end, I have updated all three charts from last year to better display sample size and opportunity data.
In this first chart, I present the raw amount of each type of play charted. I also display what percentage of a running back's rushes went in each specific direction, as well as what percentage of his targets went to each specific area of the field.
If you haven't already noticed, the biggest improvement to the charts this year is the color-coded heat maps. In addition to allowing you to quickly visualize how a running back has been used by his team, these heat maps will also help you compare a running back being charted to the rest of the sample (which I can proudly say is now 60 running backs deep).
For example, in Duke Johnson's 2016 charting, 41.3 percent of his targets were inside, which was much more frequent than most backs, and thus depicted in green. In contrast, just 6.5 percent of his targets were to the flat, which was far less frequent than most backs, and thus depicted in red.
Related: What are the Most Predictable Year-to-Year Stats for Running Backs?
The 3 Types of Charted Rushing Attempts
A running back's rushing attempts have been broken down into five total directions, or lanes, but there are really just three distinct lanes: middle/guard tackle, and end, with the latter two broken down by left/right.
1. Left/Right End: When a running back runs the ball outside the tackle box, most often with the aim of getting to the edge and turning the corner, usually on a toss, sweep, or stretch play.
League average Success Rate: 46.6%
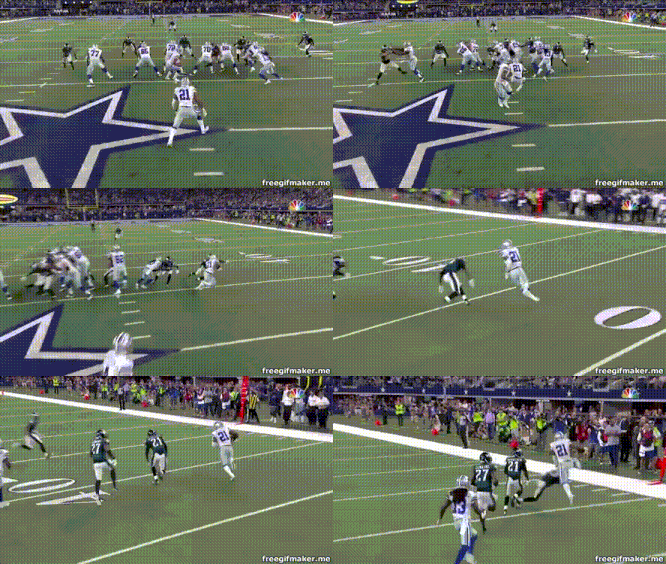
2. Left/Right Tackle: When a running back runs to the inside or outside of a block set up by one of the offensive tackles, usually on traps, counters, and various power or zone concepts.
League Average Success Rate: 46.2% (left), 44.1% (right)
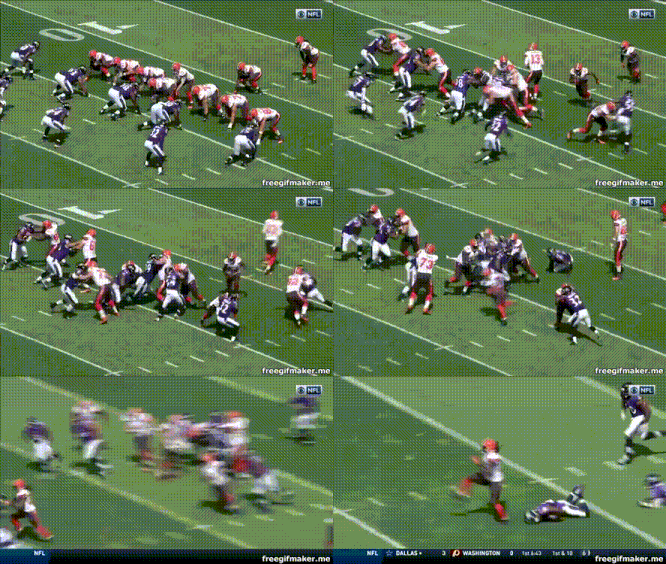
3. Middle/Guard: When a running back runs up the middle off blocking by the interior line (center, guards), usually on dives or draw plays.
League Average Success Rate: 46.4%
The 4 Types of Charted Targets
A running back's targets have been broken down into four areas of the field.
League average Success Rate (all target areas): 43.9%
1. Flat Targets: When the running back runs a route horizontal to the line of scrimmage before heading up field.
2. Inside Targets: When the running back runs a route through the offensive line as the play develops.
3. Outside Targets: Outside runs include two basic types of routes. The first is similar to inside, but the running back runs to the outside of the line before finishing their route. The second type is very similar to a flat route, but instead of running horizontally, the running back angles towards either side of the line.
4. Wide Targets: When a running back lines up on the line of scrimmage just like a wide receiver, and runs his route from there instead of starting behind the offensive line.
I decided to go with player targets instead of player receptions. The obvious reason is that it increases my sample size, but more importantly targets quantify what happens every time the quarterback throws to a running back’s area. I find target data much more intuitive than reception data.
Chart 2: Success Rate vs. Expectation
The Success Rate vs. Expectation chart is where I compare a running back's Success Rate to both his Expected Success Rate, as well as the league average. You'll also notice another new addition:
Expectation Score: A running back's actual success rate divided by his expected success rate. A number higher than 1.0 means he performed above expectation relative to blocking, and a number lower than 1.0 means he performed below expectation relative to blocking. Quantifying a running back's success rate relative to expectation is what Rushing Expectation is all about.
Again, I’m really excited about the heat maps (especially in this chart), as they allow us to visualize how well a running back has performed relative to the circumstances surrounding him.
Another thing I'll do to help with visualization is apply a dark gray fade to areas in which the sample size was especially small, specifically fewer than 10 rushing attempts to a particular direction, or fewer than 5 targets to a particular area.
As you can see from the faded sections in the sample chart above, Isaiah Crowell had less than five targets in the flat, and he also handled fewer than 10 rushing attempts toward left tackle or left end. This color coding should go a long way towards helping you decide which data points are the most relevant. Put another way, it's important to use the first two charts together, as a small sample size in a particular direction could positively or negatively skew Success Rate.
One more note: I remove un-catchable balls, such as ones batted down at the line of scrimmage or thrown out of bounds, from the sample completely when calculating Success Rate, but those targets are still included for reference in the directional sample size.
Chart 3: Overall Analysis
The final and most important of the three charts, Overall Analysis, displays a big-picture snapshot of how well a running back has performed, based on Rushing Expectation charting data.
The top portion of the chart gives the Success Rate, Team Expected Success Rate, and the league average Success Rate for both a running back's rushing and receiving plays. You will also notice a few other key stats complied charting process, which I'll explain it detail below.
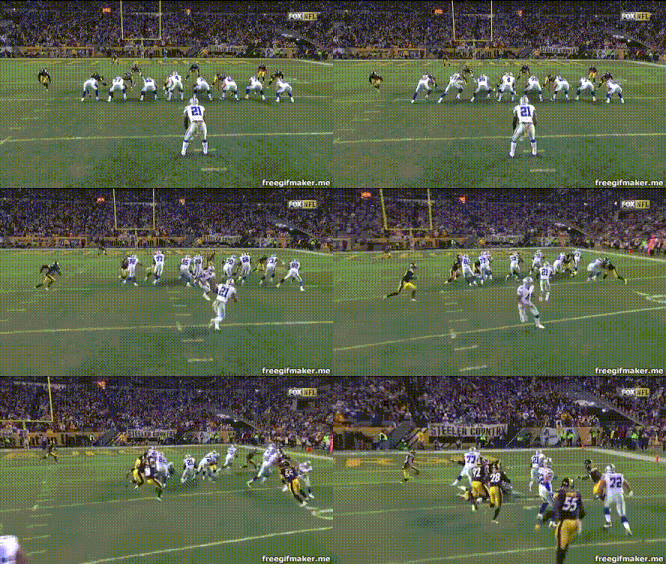
Before/After Contact Yards: Yardage per touch gained before and after the defender makes first contact. To illustrate, let’s take a look at a 27-yard run from Ryan Mathews against the Jets in Week 3 of 2015. Mathews gets the ball at his own 34-yard line and is first touched at the 38, which means he gained 4 yards before contact. He then breaks free all the way to the Jets' 34, for another 28 yards after contact:
Yards after contact is clearly a skill, but before-contact yards are extremely relevant as well. Running backs who consistently gain good yardage before contact in spite of inferior run blocking are very intriguing. Elusiveness behind the line of scrimmage is an extremely underrated, but prevalent, ability among the league’s best runners.
Potential Touches: Quite simply, total rushing attempts plus targets.
Facing 7 or less in Box: Displayed on the left his how many rushing attempts a running back had when facing a base box or softer, and on the right is his Success Rate against base or softer boxes.
Facing 8+ in Box: Displayed on the left his how many rushing attempts a running back had when facing a loaded box, and on the right is his Success Rate against loaded boxes.
Sample Size Types
The sample size of each player is something I put a lot of thought into, especially since running back is a little different than the wide receiver position; even when you add up a running back's total amount of potential touches in a given game, it usually doesn’t compare to the amount of routes a receiver runs.
There are two levels of sample size in my methodology:
- Normal sample (like Melvin Gordon from 2016)
- Limited sample (such as Jay Ajayi from 2015’s project)
The following is what gets charted for each sample:
Normal Sample (7 games, min. 75 potential touches in season/playoffs):
- Top 2 PPR-scoring games (must have at least 10 potential touches to qualify)
- Bottom 2 PPR-scoring games (must have at least 10 potential touches to qualify)
- Other 3 games are the 3 top remaining games of potential touches
Limited Sample (fewer than 7 games played, or needed more than 7 games to reach 75-touch threshold):
-
All potential touches for the entire season (including playoffs)
Film Evaluation Process
The main goal of Rushing Expectation is to mix metrics with film evaluation.
In the interest of limiting an already overwhelming amount of numbers, I will not be publishing a 1-7 scale for each attribute -- at least on the surface. I feel that translating grades into clear, easy-to-understand language is a much better way to bring you on this journey.
For reference, however, below is the scale I was taught when learning how to evaluate running back talent. Just remember that in future Rushing Expectation articles, I will be using the corresponding language, not the numbers, in reference to the scale.
For example, if I say “adequate overall strength and below-average power in short yardage situations,” it means my overall play strength grade after film evaluation was a 3 on the 1-7 scale.
Running Back Traits Being Evaluated
Below are six key traits for running backs that I evaluate in my charting process:
-
Athletic Ability: quickness, agility, balance, acceleration, explosiveness, change of direction
-
Mental Processing: instincts, football intelligence, adjustments, reaction time
-
Strength: power, 1-on-1 strength, physicality, aggressiveness at point of attack
-
Vision: creativity, improvisation, ability to find appropriate lane
-
Burst: ability to accelerate to top speed, create separation in the open field
-
Finish: ability to maintain balance through contact and gain positive yardage
What to Expect from Rushing Expectation in 2017
In hindsight, there was one glaring shortcoming of the 2016 series: the focus was on individual running backs, rather than entire backfield situations. Sure, I was down on Duke Johnson and Giovani Bernard relative to the optimistic stance of most analysts — but I failed to chart beneficiaries like Isaiah Crowell and Jeremy Hill.
So while there may have been value in avoiding guys like Duke and Gio in drafts based on my analysis, there is far more leverage in shedding light on an entire backfield, especially in committee and/or uncertain situations. (At least I got this right once.)
Related: When Should You Draft Your Running Back?
Going forward — and likely at the expense of my social life — Rushing Expectation will chart all members of a potential committee backfield, where applicable. In fact, the focus will be running backs that have unclear fantasy value heading into '17; you probably don't need me to chart David Johnson again to tell you he's a first-rounder.
So now we are looking at double the amount of players charted each offseason — but also in a more concise manner. This will give you double the value over the same amount of articles.
Running Backs to be Charted for 2017
-
BAL: Kenneth Dixon, Terrance West
-
CHI: Jordan Howard
-
CIN: Giovani Bernard, Jeremy Hill
-
CLE: Isaiah Crowell, Duke Johnson
-
DEN: C.J. Anderson, Devontae Booker
-
GB: Ty Montgomery
-
KC: Spencer Ware
-
LAR: Todd Gurley
-
MIA: Jay Ajayi
-
NYG: Paul Perkins, Shane Vereen
-
NYJ: Bilal Powell, Matt Forte
-
SD: Melvin Gordon
-
SEA: Eddie Lacy, C.J. Prosise, Thomas Rawls
-
SF: Carlos Hyde
-
TEN: DeMarco Murray, Derrick Henry
-
WAS: Rob Kelley, Chris Thompson
Gaining Access to the Complete Collection of Rushing Expectation Profiles
Due to the insane amount of work that goes into charting each of these profiles, access to the complete Rushing Expectation collection this year will require at least a 4for4 Classic Subscription ($29).
Without a subscription, only 11 of the 21 profiles will be accessible.
Hopefully this walkthrough gave you a better idea of what to expect. Of course, if you have any further questions feel free to contact me on twitter @JoeHolka.
Again, transparency is the number-one goal in my process, and I hope you enjoy the '17 version of Rushing Expectation.
Related Articles
- Stop Taking Adrian Peterson Over Mark Ingram in Fantasy
- 6 Reasons Jordan Howard Will Not Be a Fantasy Football Bust
- Using Red Zone Expected Value to Find 5 Running Back Touchdown Regression Candidates
- What are the Most Predictable Year-to-Year Stats for Running Backs?
- Leonard Fournette, Samaje Perine & the Other Rookies That Will Make a Fantasy Impact in 2017
- How Effective Will Marshawn Lynch Be in 2017?
- When Should You Draft Your Running Back?
- How Often Do Top-12 PPR Running Backs and Wide Receivers Repeat the Following Season?
- 2017 Initial Rankings: A Closer Look at Bilal Powell, Danny Woodhead and Theo Riddick
- What the Move to Philadelphia Means for LeGarrette Blount
- Danny Woodhead Had RB1 Upside at This Time Last Year - Does He Still?


