How to Win Best-Ball Leagues: MFL10 vs Draft

Thank you to Josh Hermsmeyer for co-authoring and compiling the data used in this article. Follow Josh on Twitter: @friscojosh.
Over the last few offseasons, best-ball fantasy football leagues have risen in popularity, and with that popularity has come analysis explaining how to optimize best-ball drafting strategy. Those core optimization concepts, which differ greatly from strategies for traditional redraft leagues, were summed up quite nicely here at 4for4, last season.
Prior to 2017, MFL10s were the dominant best-ball platform but Draft best-ball leagues soared in popularity last season. Owners must now consider whether or not they should adjust their approach to best-ball depending on which platform they choose. (Hint: They should.) Just like it’s often unwise to roll out the same DFS lineups on both FanDuel and DraftKings, the different scoring systems and roster requirements on the two most popular best-ball sites led to a subtle, but not insignificant, disparity in how winning teams were built.
Before getting into the meat of the data, I should note the major differences between the two sites. While MFL10s use a 20-player roster with a team defense and full-PPR scoring, Draft only utilizes 18 roster spots with no defense and a half-PPR system. Another slight distinction is that Draft awards .04 points per passing yard and penalizes a single point for an interception; MFL10s count .05 points per passing yard with -2 points per interception. Both platforms start 1 QB, 2 RBs, 3 WRs, 1 TE, and an RB/WR/TE Flex.
What is the Best Position to Draft From?
Last season, we showed that having a top-three pick resulted in the highest win rates and a similar trend continued into 2017.
| Draft Position | Win Rate (%) |
|---|---|
| 1 | 4.7 |
| 2 | 15.7 |
| 3 | 13.7 |
| 4 | 11.3 |
| 5 | 7.7 |
| 6 | 7.6 |
| 7 | 8.0 |
| 8 | 7.0 |
| 9 | 6.3 |
| 10 | 7.1 |
| 11 | 5.9 |
| 12 | 4.7 |
| Draft Position | Win Rate (%) |
|---|---|
| 1 | 3.3 |
| 2 | 15.1 |
| 3 | 15.6 |
| 4 | 10.1 |
| 5 | 8.8 |
| 6 | 8.9 |
| 7 | 8.6 |
| 8 | 7.9 |
| 9 | 7.0 |
| 10 | 5.6 |
| 11 | 5.0 |
| 12 | 4.2 |
There was a slight discrepancy between the two sites in terms of the top position to draft from, as the No. 2 spot in MFL10s resulted in a 15.7% win rate, while drafting from the No. 3 spot led the way on Draft with a 15.6% win rate. Avoiding a first-round landmine is a huge factor in a successful season, but a look beyond the first round lends more insight as to why the top portion of best-ball drafts often produces the most winning teams. Consider the players who showed up on the winning teams most often last season.
| Player | Position | Win Rate (%) | ADP |
|---|---|---|---|
| Todd Gurley | RB | 30.8 | 21.4 |
| LeVeon Bell | RB | 24.1 | 2.1 |
| Alvin Kamara | RB | 20.9 | 140.2 |
| Antonio Brown | WR | 20.1 | 3.5 |
| Larry Fitzgerald | WR | 19.0 | 51.3 |
| Mark Ingram | RB | 19.0 | 57.6 |
| DeAndre Hopkins | WR | 18.7 | 24.2 |
| Kareem Hunt | RB | 17.8 | 109.4 |
| Russell Wilson | QB | 16.1 | 76.8 |
| Adam Thielen | WR | 14.9 | 109.7 |
| Player | Position | Win Rate (%) | ADP |
|---|---|---|---|
| Todd Gurley | RB | 37.0 | 20.4 |
| Alvin Kamara | RB | 23.5 | 164.6 |
| Kareem Hunt | RB | 19.8 | 73.6 |
| Russell Wilson | QB | 18.6 | 75.4 |
| DeAndre Hopkins | WR | 18.6 | 30.1 |
| Mark Ingram | RB | 17.9 | 57.4 |
| LeVeon Bell | RB | 16.8 | 2.0 |
| Antonio Brown | WR | 16.6 | 3.3 |
| Tyreek Hill | WR | 15.6 | 44.8 |
| Zach Ertz | TE | 15.2 | 93.3 |
On both sites, only four players in the top 30 selections finished in the top 10 in win rate. Taken a step further, no other player taken in the first 30 picks had a top-20 win rate in MFL10s. On Draft, you had to go down to the 40th-best win rate to find the fifth player drafted within the first 30 picks.
The early-round players who did show up with high win rates were in a very specific portion of drafts: high in the first round and late in the second/early in the third. This is a trend that goes back at least to last year and has a narrative that can be shoehorned around it.
In the late second/early third, there figures to be a select group of players who can reasonably be projected for relatively high volume at their position but are coming off of a statistically underwhelming season. Last season those players were Todd Gurley and DeAndre Hopkins. In 2016, LeSean McCoy, Jordy Nelson, and T.Y. Hilton fit the bill. Coming off of a bad fantasy year, owners will typically show trepidation towards these players in the front half of the second round, knowing they have to wait quite some time until their next pick.
This doesn’t mean owners are necessarily doomed by their draft slot, though. In order to combat this apparent advantage owners can get from an early draft slot, best-ball owners picking in the back half of the first round should consider reaching for players with slightly later ADPs in the second round. This is an especially effective way to build unique teams in the early rounds where ADP is generally more static than in the mid and late rounds.
Beyond the first couple of rounds, draft position ties little into player win rate—the later you are in a draft, the more variance there will be among ADP. In other words, your draft slot likely has little to do with whether you landed Alvin Kamara or not last year.
Which Roster Construction is Best?
In 2016, the most common roster construction and the build resulting in the most first-place finishes was 2 QB, 6 RB, 7 WR, 3 TE, and 2 DEF. The 2017 season yielded the same results for MFL10s. On Draft, the roster build with the most wins was 2 QB, 6 RB, 7 WR, and 3 TE. (Recall that Draft does not implement a team defense).
In the past, we’ve focused on the win rates of specific roster builds, but forcing a particular construction could be a fool’s errand—roster construction is so dependent on early-round picks and draft position that it may be more productive to look at a range of strategies as it pertains to the number of players drafted at each position and their respective win frequencies.
| Position | Times Drafted | % of Winning Teams |
|---|---|---|
| D | 2 | 73.6 |
| QB | 2 | 61.4 |
| TE | 3 | 53.1 |
| WR | 7 | 51.6 |
| RB | 6 | 48.2 |
| TE | 2 | 45.4 |
| QB | 3 | 35.8 |
| RB | 5 | 33.3 |
| WR | 8 | 24.9 |
| D | 3 | 20.6 |
| WR | 6 | 17.9 |
| RB | 7 | 12.9 |
| D | 1 | 5.5 |
| RB | 4 | 4.0 |
| WR | 9 | 4.0 |
| QB | 4 | 2.0 |
| WR | 5 | 1.4 |
| TE | 4 | 1.4 |
| RB | 8 | 1.3 |
| QB | 5 | 0.5 |
| D | 4 | 0.3 |
| WR | 10 | 0.3 |
| RB | 3 | 0.2 |
| QB | 6 | 0.2 |
| QB | 1 | 0.1 |
| Position | Times Drafted | % of Winning Teams |
|---|---|---|
| QB | 2 | 51.9 |
| RB | 6 | 51.6 |
| WR | 7 | 49.5 |
| TE | 3 | 49.3 |
| TE | 2 | 47.6 |
| QB | 3 | 46.0 |
| RB | 5 | 25.7 |
| WR | 8 | 23.5 |
| WR | 6 | 21.6 |
| RB | 7 | 18.4 |
| WR | 9 | 3.6 |
| RB | 4 | 2.6 |
| TE | 4 | 2.2 |
| QB | 4 | 1.7 |
| RB | 8 | 1.5 |
| WR | 5 | 1.4 |
| TE | 1 | 0.8 |
| QB | 1 | 0.3 |
| WR | 10 | 0.3 |
| TE | 5 | 0.2 |
| RB | 3 | 0.1 |
| QB | 5 | 0.1 |
| RB | 9 | 0.1 |
| WR | 3 | 0.0 |
| WR | 4 | 0.0 |
The data from 2017 reiterates what we have learned from looking at overall roster construction strategies in the past. There is a clear range at each position that is optimal for building a winning best-ball portfolio, with those ranges as follows:
- QBs: 2–3
- RBs: 5–7
- WRs: 6–8
- TEs: 2–3
- DEF: 2–3
It’s notable that 2 QBs yielded a top-two win percentage on both sites and that 2 DEF produced the most leagues in MFL10s last season. This highlights the importance of drafting in accordance with league settings. Because best-ball optimizes each team’s score every week, and QB and DEF scoring is generally quite flat, it behooves drafters to allocate more roster spots to positions that can contribute to the Flex rather than adding a third QB or DEF. In looking at all possible QB/DEF combinations within our given ranges (2QB/2DEF, 2QB/3DEF, 3QB/2DEF, or 3QB/3DEF), 3 QBs and 3 DEF have yielded the lowest win rate over the past two seasons. If we include TE into the mix, 3QB/3TE/3DEF has been the worst possible combinations in terms of win rate in MFL10s as it pertains to roster construction and the “onesie” positions.
The number of positions on winning teams shows that owners should—at least in some circumstances—consider which platform they are playing on when deciding on roster construction. A seventh RB on Draft offered almost a 6% higher win rate than a seventh RB in MFL10s, while opting for only six WRs had almost a 5% higher win rate on Draft than on the MFL platform. This difference likely comes down to the half-PPR vs full-PPR formats and could be the tiebreaker at the end of the draft if an owner has two players from different positions rated equally.
How Many Points Do You Need to Win?
A look at scoring on both sites showed a relatively normal distribution of scores from winning teams.
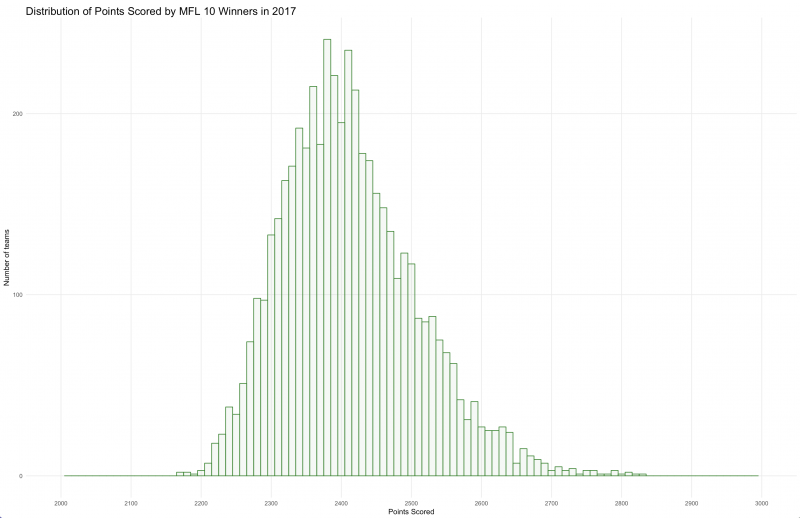
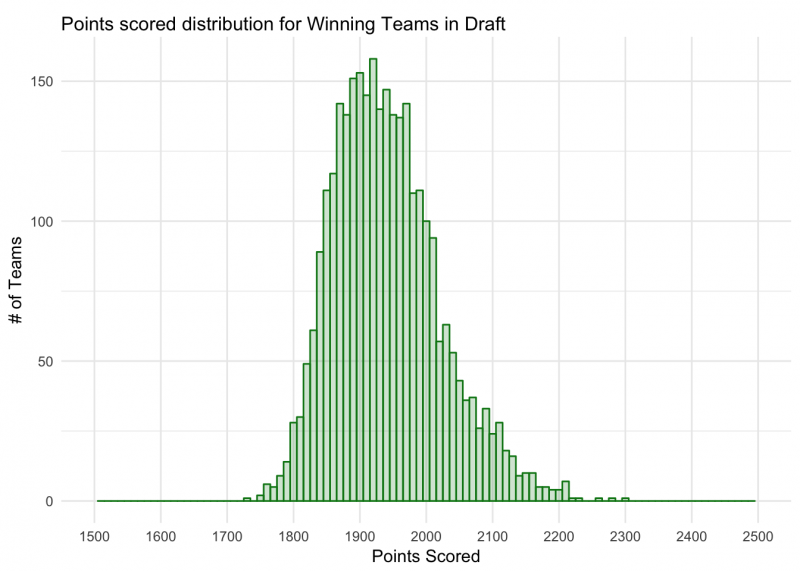
In MFL10s, the average winner scored 2,402.2 points with a standard deviation of 95.8 points and winners on the Draft platform averaged 1,932.2 points with a standard deviation of 78.1 points. While an average target score doesn’t offer much in terms of drafting strategy, the fact that there is a relatively normal distribution of winning scores does offer a lesson.
Since we know that, over the course of the entire draft season, winning scores will fall into a somewhat normal distribution, owners should try to play as high of volume as possible in hopes of getting exposure to those leagues where a lower score is required to win. A quick rule of thumb is to aim for at least 30 leagues—within any random set of data, as that data set approaches a sample size of 30, it is more likely that the data set will fall into a normal distribution. In addition to getting exposure to a lower scoring league, higher volume is more likely to ensure a fair number of picks near the top of the draft.
A look at winning scores across different months showed a negligible difference in average winning scores or scoring distributions based on time period. Rather than playing best-ball throughout the year in hopes of finding weaker competition, owners should space out their drafts for natural player and opponent diversification—different people will be playing at different times and the natural swings in ADP will allow owners to have a diversified player portfolio even without a huge change in draft philosophy or player valuation.
Which Players Should You Target on Each Site?
Like the subtle differences in roster construction techniques between the two sites mentioned earlier, the contrast in scoring systems between Draft and MFL10s should have an influence on which players are being drafted. Because of the half-PPR nature of Draft, touchdowns carry more weight than in MFL10s. Conversely, a full-PPR format like MFL10s allows more consistent players to prop up winning teams, even if they don’t dominate touchdowns. Let’s revisit the players with the highest win rates, zoomed out slightly more than our first look.
| Player | Position | Win Rate (%) | ADP |
|---|---|---|---|
| Todd Gurley | RB | 30.8 | 21.4 |
| LeVeon Bell | RB | 24.1 | 2.1 |
| Alvin Kamara | RB | 20.9 | 140.2 |
| Antonio Brown | WR | 20.1 | 3.5 |
| Larry Fitzgerald | WR | 19.0 | 51.3 |
| Mark Ingram | RB | 19.0 | 57.6 |
| DeAndre Hopkins | WR | 18.7 | 24.2 |
| Kareem Hunt | RB | 17.8 | 109.4 |
| Russell Wilson | QB | 16.1 | 76.8 |
| Adam Thielen | WR | 14.9 | 109.7 |
| Chris Thompson | RB | 14.7 | 181.0 |
| Zach Ertz | TE | 14.4 | 95.5 |
| Golden Tate | WR | 14.1 | 46.7 |
| Marvin Jones | WR | 13.7 | 114.6 |
| Tyreek Hill | WR | 13.1 | 48.5 |
| Player | Position | Win Rate (%) | ADP |
|---|---|---|---|
| Todd Gurley | RB | 37.0 | 20.4 |
| Alvin Kamara | RB | 23.5 | 164.6 |
| Kareem Hunt | RB | 19.8 | 73.6 |
| Russell Wilson | QB | 18.6 | 75.4 |
| DeAndre Hopkins | WR | 18.6 | 30.1 |
| Mark Ingram | RB | 17.9 | 57.4 |
| LeVeon Bell | RB | 16.8 | 2.0 |
| Antonio Brown | WR | 16.6 | 3.3 |
| Tyreek Hill | WR | 15.6 | 44.8 |
| Zach Ertz | TE | 15.2 | 93.3 |
| Adam Thielen | WR | 15.1 | 105.8 |
| Robby Anderson | WR | 15.0 | 161.3 |
| Larry Fitzgerald | WR | 14.1 | 54.4 |
| Marvin Jones | WR | 13.8 | 103.6 |
| Carson Wentz | QB | 13.8 | 131.8 |
With their touchdown dominance, Todd Gurley and Alvin Kamara offered a markedly higher win rate on Draft than in MFL10s, while players like Tyreek Hill and passing touchdown leaders Russell Wilson and Carson Wentz both turned in noticeably higher win rates on Draft. Meanwhile, consistent target volume allowed players such as LeVeon Bell, Antonio Brown, Larry Fitzgerald, and Chris Thompson to turn in much higher win rates in MFL10s than on Draft. When owners have players graded equally, players with consistent volume should get the nod in MFL10s, while big-play threats or players who rely heavily on red zone volume should be favored on Draft.
How To Win Best-Ball Leagues (Recap)
- Owners with an early first-round pick have generally had the advantage in best-ball, not just because of the first-round pick, but also because of the value that often falls to the late-second/early-third rounds. Other owners can combat this by taking more risks in the early second round, especially on players projected for high volume coming off of a down year.
- Roster construction should vary depending on the flow of the draft and the strength of your players at each position. There is a general range of players owners should strive for at each position and that range may be adjusted depending on the platform.
- Owners should look to maximize their opportunities to win the Flex position whenever possible—given the opportunity between a skill-position player or a QB or DEF, it's often better to choose the skill position.
- Playing higher volume will allow owners to get fair exposure to lower scoring leagues and higher draft picks.
- The platform you’re playing on should influence player selection. MFL10’s full-PPR system favors target volume and consistency, while Draft’s half-PPR scoring props up touchdown-dependent players and top-scoring QBs.
Related Articles


