The Most Predictable Wide Receiver Stats

At long last, we get to the best position in football: wide receiver. It’s also historically the most predictable position for fantasy points, with John Paulsen’s positional ranking making up the largest share of the model for any position. And that makes sense. Volume can’t solely be dictated by the whims of the coaching staff like it can at running back.
More Predictable Stats: QB | RB | TE
Designed looks aside, you have to win on your route and get separation on a defensive back to earn us fantasy points. To do that, you have to be talented. If A.J. Brown is injured in a given week, Jahan Dotson will not step in and replace his production. Instead, the talented players on the Eagles offense like DeVonta Smith will earn a larger share of the looks. That is, whenever the Eagles remember that the forward pass is legal. Let’s dig into those talent metrics at the wide receiver position.

DraftKings is giving ALL customers a can't-miss offer for Best Ball: Draft One, Get One! Enter a lineup in the $15 Million Best Ball Contest for just $20, and you'll score another Best Ball ticket to play FREE for a share of $15 million—giving you a second shot to win big!
Modeling Process and Results
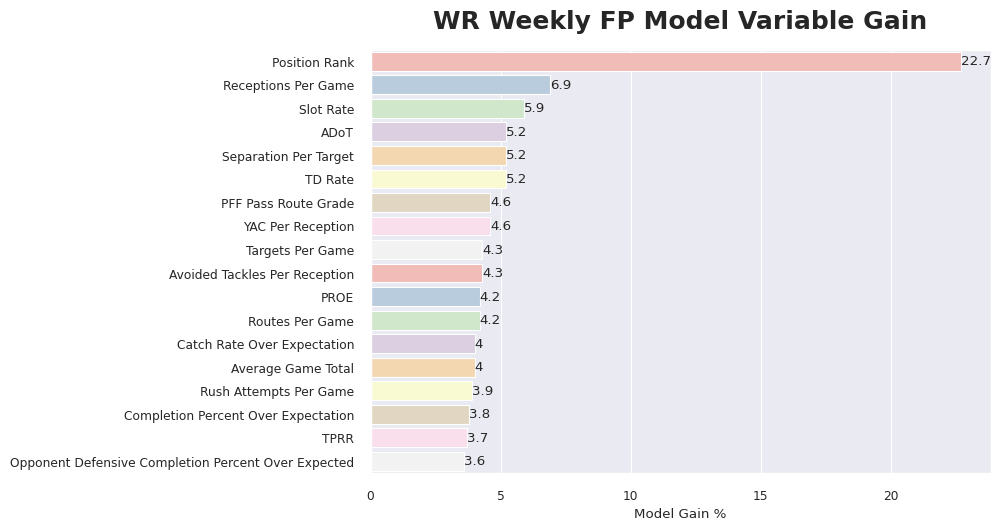
I expanded on this more in the QB article, but I’m taking a different approach this year. Instead of looking at each variable in a vacuum, I’m evaluating all variables at once. And one of those variables is market ADP. Additionally, I’m using weekly rather than seasonal data. To dig into the WR model specifically, let’s start by seeing how much each variable contributes to the model (aka its gain). That’s what the graph below does. It lists each variable in the model and the percentage it contributes to the model.
To look at how each individual variable works, we can use a partial dependence plot. These plots isolate the variable we’re looking at (in this case, position rank) and show how future fantasy points change as you move the position rank of the WR. Position rank is John Paulsen’s weekly rank going back to 2021.
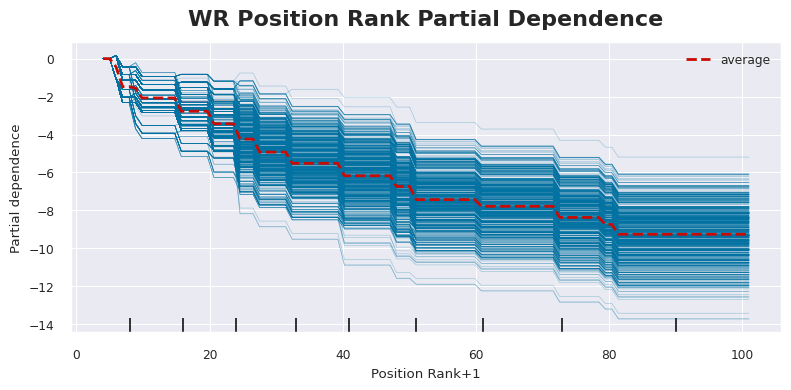
The overall trend is intuitive. As the projected rank of the WR increases (gets worse), their future fantasy points decrease. But focusing on the red average line below, you see a big dip after rank seven. And then things really start flattening out after rank 27. That means historically, we have more confidence that WRs ranked in the top seven will perform at an elite level, and then WRs ranked after 27 have lower upside potential.
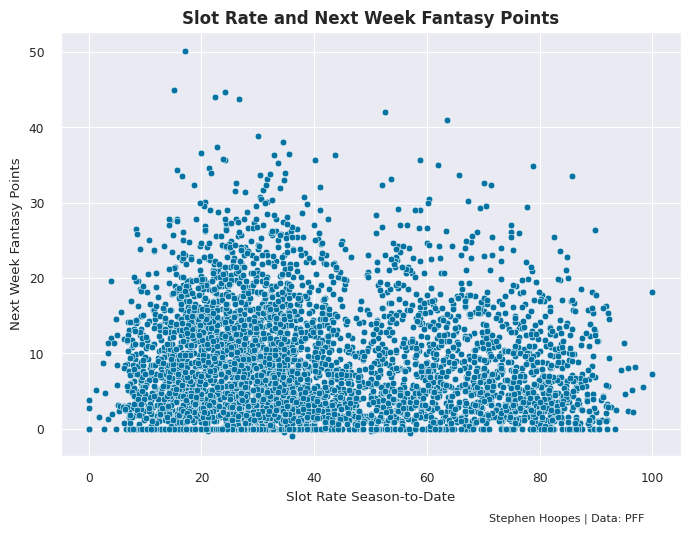
One interesting variable that popped up is slot rate. And I think it’s a key point about the process that I’m using. In most analyses like these, you’d be reading a lot about correlation. But specifically, linear correlation. There’s nothing wrong with that, but it is one particular way to look at things. In that analysis, slot rate wouldn’t pop up. There is no linear correlation between a WR’s slot rate and their future fantasy points. But there is an interesting relationship nonetheless.
The graph below shows a WR’s share of routes from the slot at a particular point in the season on the x-axis. And the y-axis shows their fantasy points in their next game. You can kind of draw an arch or half-circle over the data. The values tend to be smaller on both the left and right sides of the graph. And that makes sense. We want our WRs in fantasy to get lay-up targets over the middle of the field but also to have the ability to win on the outside. That alignment flexibility is itself a talent metric. And it’s why the best WRs in fantasy have a slot rate from 27-50%.
2025 WR Predictions
So, what does the 2025 veteran WR landscape look like? The table below sorts them by their projected fantasy points per game using the above methodology. And I’ve highlighted in green the stats where a WR exceeded a key benchmark and in red when they failed to hit a key value. As mentioned, position rank is the most important variable in the model. After that, we have a lot of talent metrics and volume metrics that are really just manifestations of talent. Those include receptions per game, separation per target, PFF grade, and tackle avoidance, among others.
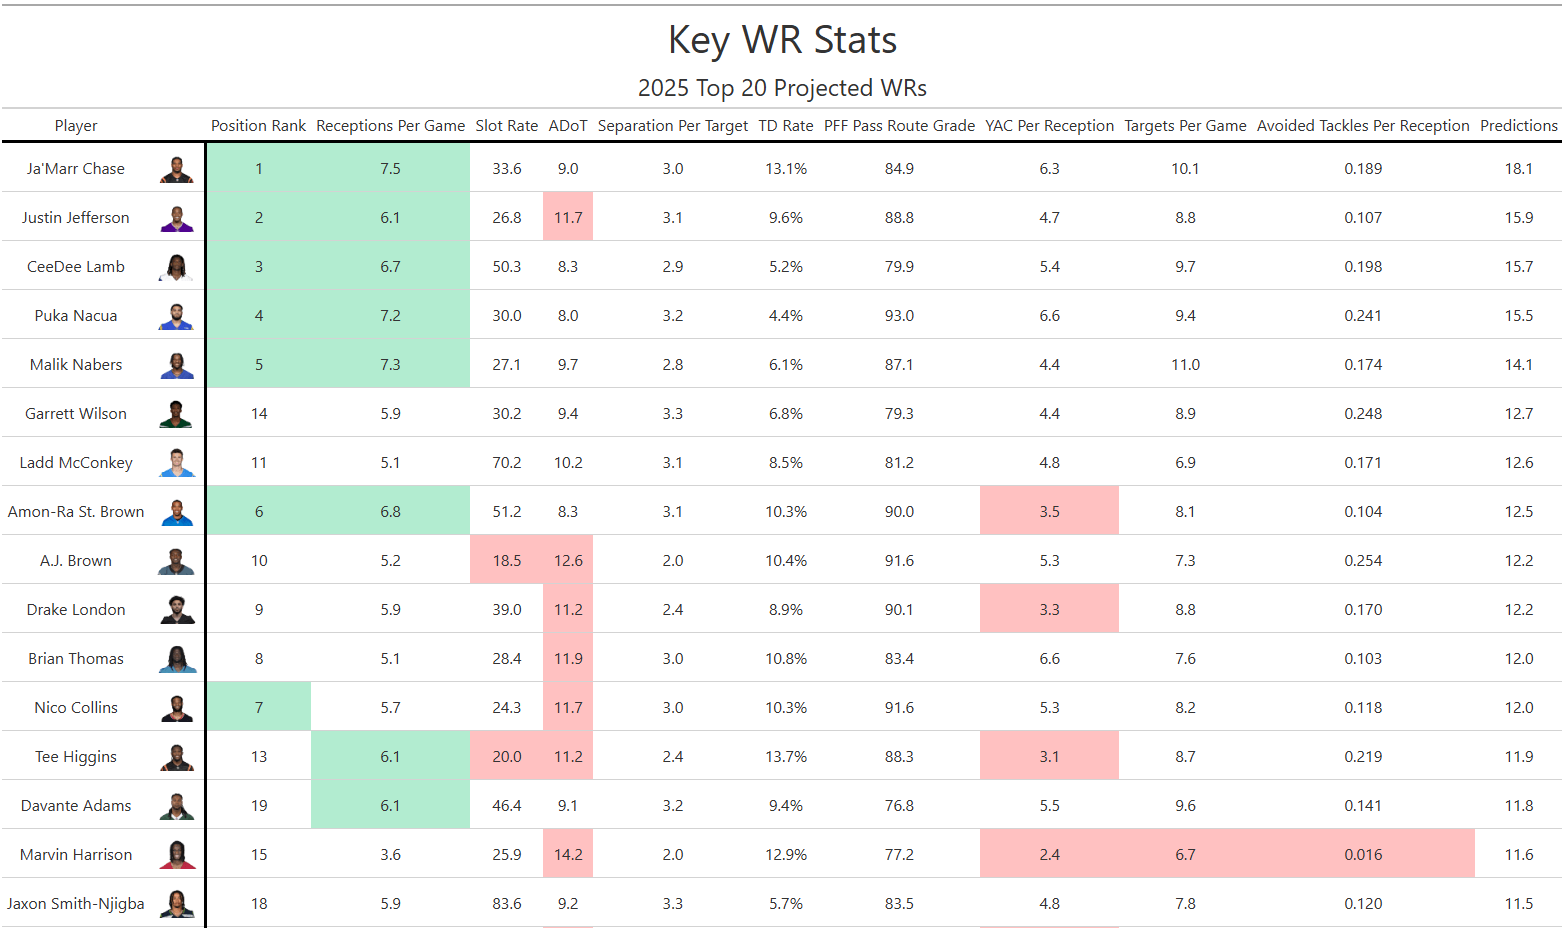
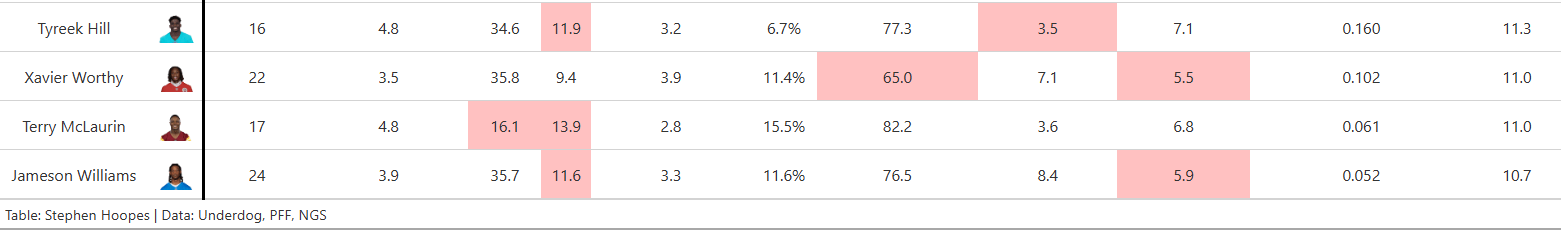
But we also have some key team context variables. Things like a team’s pass rate over expectation (PROE), future-week game total, and a QB’s completion percent over expectation. I’ve been rattling on about talent this entire article, but a WR also cannot get the ball to themselves. We ideally have a WR operating in an environment with a positive PROE, high game totals, and an accurate QB. And in most cases, the talent of the QB dictates how often a team wants to pass and how many points they’ll be expected to score.
I didn’t want to editorialize the data too much, but this is a big point for Garrett Wilson’s projection. The graph below shows team PROE on the x-axis and how much that varied weekly on the y-axis. You’ll find last season’s Jets in the bottom-right corner. They were top-five in PROE and one of the four most consistent teams in the league with their approach. Aaron Rodgers wasn’t missing ayahuasca trips to hand the ball off to an RB.
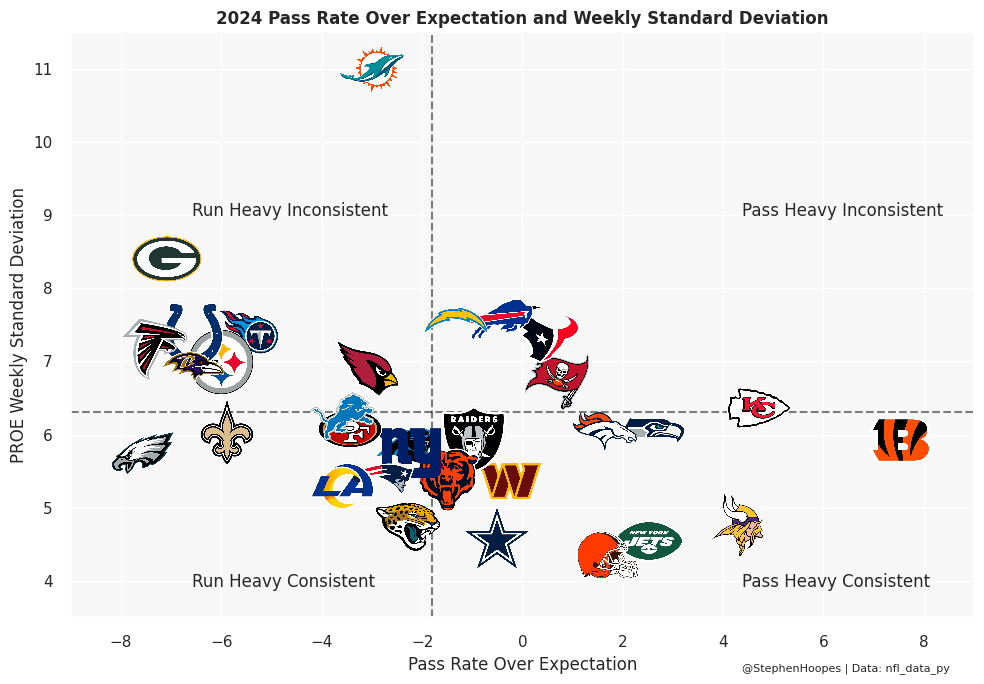
Well, things are about to change for Garrett Wilson and the Jets in 2025. A big part of Wilson’s projection here is based on the team’s PROE and the availability of those nine targets per game he saw last season. I’ll eat my hat if the Jets have a positive PROE in 2025 with Justin Fields at the helm. Fields naturally takes pass attempts out of the offense by rushing. And the lack of confidence in Fields’ arm should make the coaching staff opt to run more often than on a Rodgers team where he is both QB and offensive coordinator.
With the Jets rant over, let’s get back to our regularly-scheduled programming. This analysis is a big reason why I really want to start with a WR in round one this year. The five WRs that separate from the pack here are Ja’Marr Chase, Justin Jefferson, CeeDee Lamb, Puka Nacua, and Malik Nabers. Now, no duh. These are all elite players. But the projections drop off pretty sharply after those five names.
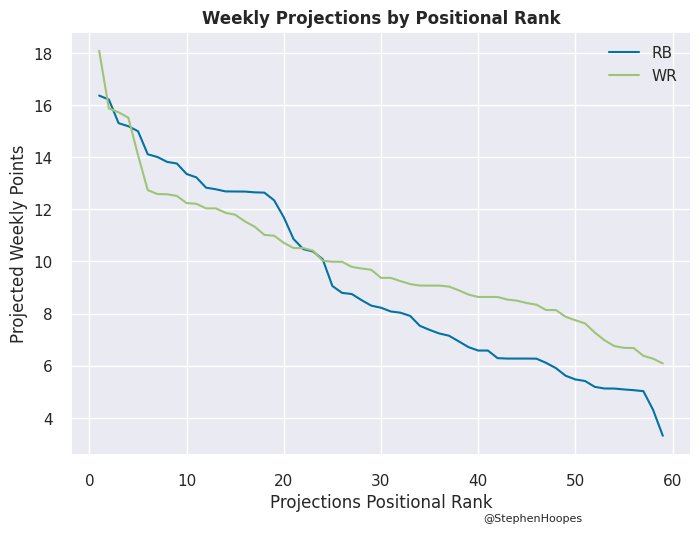
The graph below shows the projected points by positional rank split between RBs and WRs. You’ll notice the alien Chase in the top-left and then the other four names I listed projected at or above the top-five RBs. And then there is a large span of players where the RBs project better than the WRs, up to about positional rank 20. And so, I really want one of those five names in round one before switching to an RB like De’Von Achane in round two.
Now, this comes with a massive caveat that we shouldn’t draft off of projections alone. We’re really hunting for the dozen or so players each season that dictate the landscape of fantasy football. We should only be selecting players that we think have league-winning upside in redraft leagues. But I still think this positional projection comparison is useful for determining what is not available to you later in the draft. And to me, that’s one of those elite WRs with the mix of talent and offensive situation (ignoring the Giants situation with Nabers) that simply aren’t available after round two.

Bottom Line
• This year, I’m incorporating ADP in order to find variables that provide additional context beyond existing market assumptions.
• 4for4’s weekly position ranking is the most important variable when predicting future week fantasy points.
• Variables like slot rate have a relationship with future fantasy points even if they’re not linearly correlated.
• The market is not fully baking in the importance of talent for WRs, with separation per target, PFF grade, and tackle avoidance providing important context.
• But team environment is also critical at a position that is reliant on QB play that allows for a high number of accurate passes and high game totals.
• There are five WRs with projections that really separate from the pack and are only available in round one of our drafts.