The Most Predictable Tight End Stats
Let’s close out the series with tight ends. The most fun thing I found when doing this analysis was that rushing yards were useful when projecting future-week TE fantasy points. The graph below shows the partial dependence plot for rushing yards per game among TEs. I’ll dig more into what that means later, but for now, just look at the x-axis. We’re not asking for much here. Literally 0.1 rushing yards per game is enough to improve a TE’s projection.
More Predictable Stats: QB | RB | WR

DraftKings is giving ALL customers a can't-miss offer for Best Ball: Draft One, Get One! Enter a lineup in the $15 Million Best Ball Contest for just $20, and you'll score another Best Ball ticket to play FREE for a share of $15 million—giving you a second shot to win big!
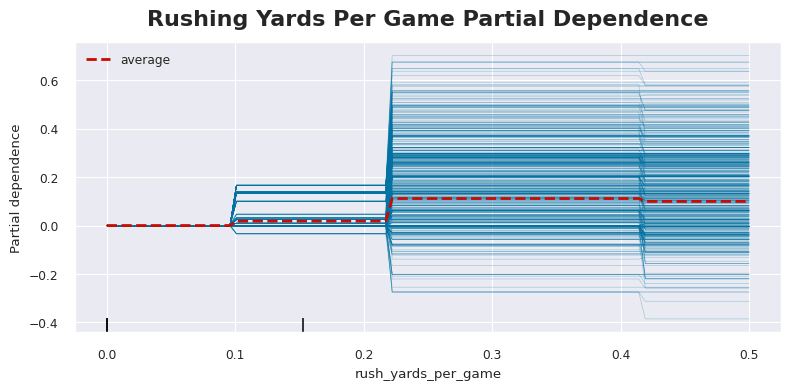
So, it’s really not the fantasy points we’re getting from rushing that matter. It’s more an indication of talent and a willingness to get a TE involved in the offense. The names of the TEs with non-zero rushing yards per game will probably help here. They are Brock Bowers, Tucker Kraft, Mark Andrews, Trey McBride, and Travis Kelce. These players are talented enough and trusted enough in their offenses to earn these opportunities, which is a signal to fantasy managers that they will project well in future weeks. Let’s dig more into the other variables in the model below.
Modeling Process and Results
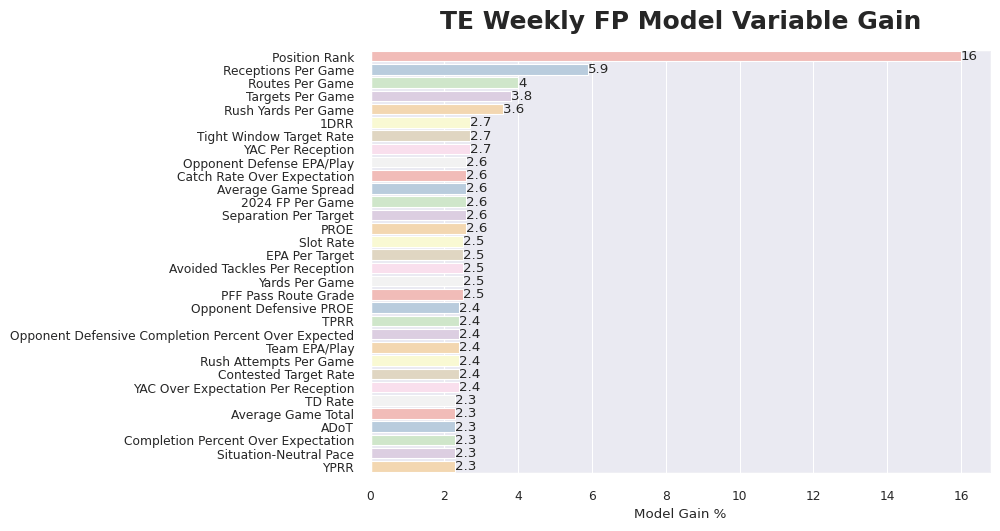
I expanded on this more in the QB article, but I’m taking a different approach this year. Instead of looking at each variable in a vacuum, I’m evaluating all variables at once. And one of those variables is market ADP. Additionally, I’m using weekly rather than seasonal data. To dig into the TE model specifically, let’s start by seeing how much each variable contributes to the model (aka its gain). That’s what the graph below does. It lists each variable in the model and the percentage it contributes to the model.
To look at how each individual variable works, we can use a partial dependence plot. These plots isolate the variable we’re looking at (in this case, position rank) and show how future fantasy points change as you move the position rank of the TE. Position rank is John Paulsen’s weekly rank going back to 2021.
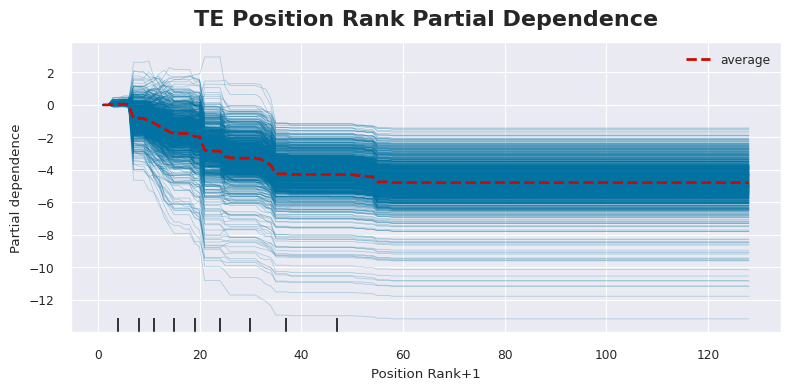
The overall trend is intuitive. As the projected rank of the TE increases (gets worse), their future fantasy points decrease. But focusing on the red average line above, you see a big dip after rank six. And then things really start flattening out after rank 20. That means historically, we have more confidence that TEs ranked in the top six will perform at an elite level, and then TEs ranked after 20 have lower upside potential.
One interesting variable that popped up is the tight window target rate from Next Gen Stats. It counts a tight window target as one where the separation between the receiver and the nearest defender is less than one yard at pass arrival. The graph below shows a TE’s average tight window target rate at a particular point in the season and how many fantasy points they scored in their next game.
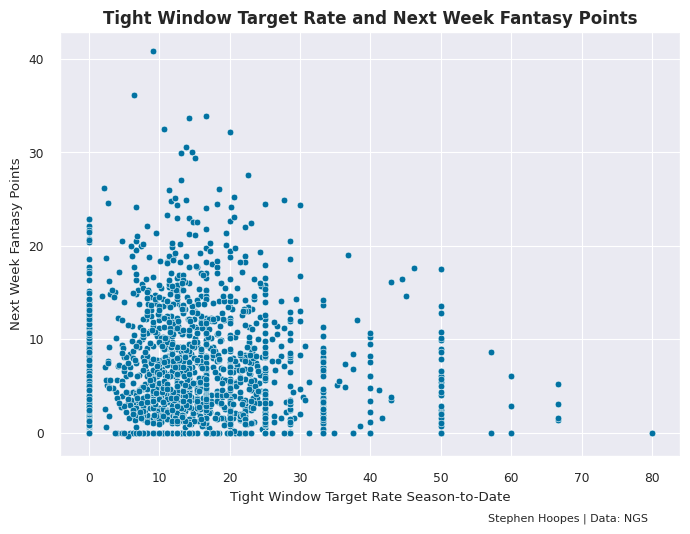
I think the distribution is pretty intuitive. As your tight window target rate increases above 20% or 30%, your future week fantasy point ceiling decreases. If a lot of your targets are coming with limited separation, you’re probably just not very good at creating separation. That is going to limit your target ceiling and your production on the targets you do get. But you also don’t want a very low, tight window target rate like 5%. We want the QB to look our TEs’ way even when they’re not fully open. It’s similar to slot rate for WRs, where we’re just trying to avoid the extremes. The biggest names here are Travis Kelce’s 8.2% tight window rate on the low end and Kyle Pitts’ 27.0% tight window rate on the high end.
2025 TE Predictions
With that in mind, what does the comprehensive view of the veteran TE landscape look like? The table below sorts them by their projected fantasy points per game using the above methodology. And I’ve highlighted in green the stats where a TE exceeded a key benchmark and in red when they failed to hit a key value. As mentioned, position rank is the most important variable in the model. After that, it’s simple volume stats like receptions, routes, and targets per game.
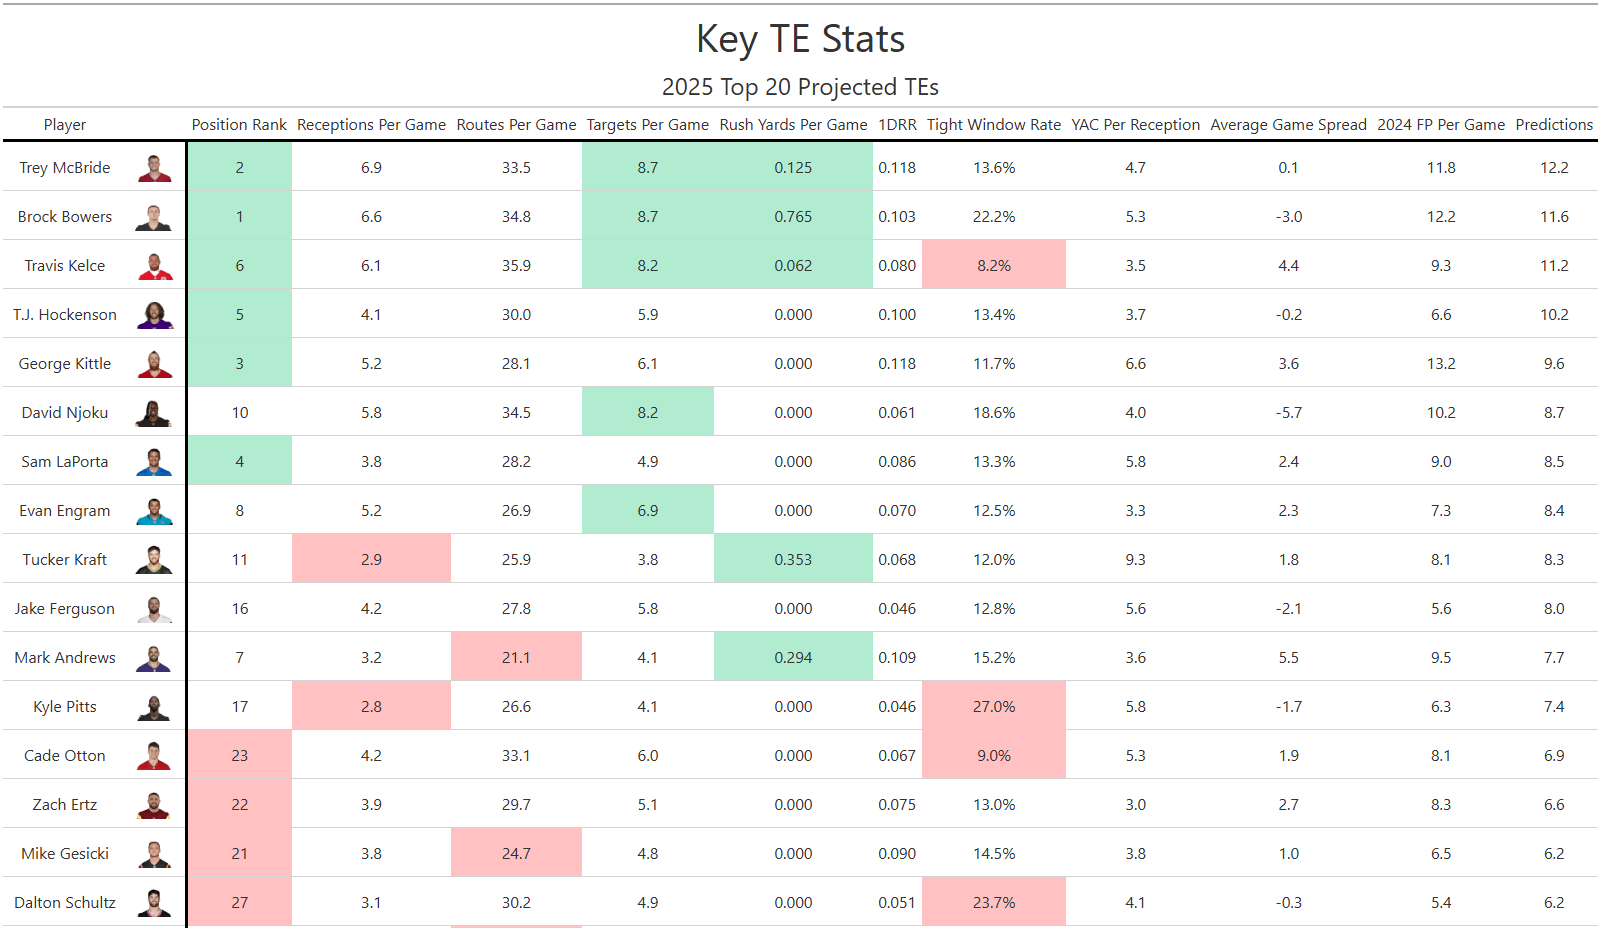

We’ve already discussed both rushing yards and tight window rate. And then it’s a ton of efficiency and talent-based stats like first downs per route run (1DRR), yards after catch (YAC) per reception, and catch rate over expectation. Those are followed by team context variables, like we saw at WR. Those include average sportsbook game totals and spreads, team EPA per play, and situation neutral-pace.
While touchdowns themselves are pretty fluky, it doesn’t change the fact that touchdowns as a share of fantasy points are most important at the TE position. With that in mind, we want our fantasy TEs to play on offenses with talented QBs and offensive play callers that pass efficiently at a rate above expectation. That at least gives them the best chance to get a spiked TD rate.
One specific TE I wanted to talk more about with these projections is George Kittle. His weekly projection as the TE5 is noticeably lower than his TE3 ADP. He gets dinged a lot by the lack of volume. He ran about six fewer routes per game than McBride and Bowers and saw about 2.6 fewer targets per game. So, he turned in the TE1 overall season last year on amazing efficiency and TD rate. That’s not something I typically want to bet on continuing, but we have such a great track record with Kittle doing this exact same thing.
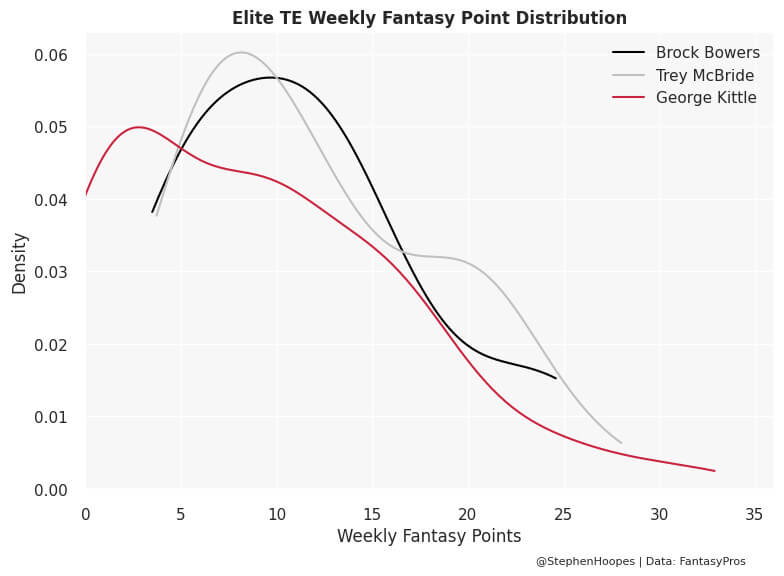
The graph below shows the distribution of weekly fantasy points for Bowers, McBride, and Kittle. Bowers and McBride have a larger share of “usable” weekly performances compared to Kittle. But Kittle still has excellent week-winning ceiling outcomes. Definitely small samples here for McBride and especially Bowers, but this is why I view Kittle as a better pick than T.J. Hockenson (for example). We’re trying to find these guys with league-winning upside rather than solely focusing on weekly median projections.
Bottom Line
- This year, I’m incorporating ADP in order to find variables that provide additional context beyond existing market assumptions.
- 4for4’s weekly position ranking is the most important variable when predicting future week fantasy points.
- Some fun variables like rushing yards per game and tight window target rate popped up as valuable, mostly as measures of player talent.
- But simple stats like routes, targets, and receiving yards per game add the most context to position rank.
- Ultimately, we’re still shooting for league-winning upside, so always consider that on top of median projections.


