How Offensive Line Play Impacts Fantasy Football

Fantasy football isn’t getting any easier. Every season brings a wave of new rookies, depth chart shakeups, and coaching changes that are tough to evaluate in real time. You can do all the prep work, study rankings, read draft guides, and track every blurb, but if you’re not accounting for offensive line play, you’re missing a key part of the picture.
Offensive lines don’t grab headlines like highlight catches or breakout running backs, but they impact everything we care about in fantasy. Clean pockets. Rushing lanes. Drives that keep moving instead of stalling. These outcomes often begin with the five guys up front. Yes, some players can make magic on their own. But when we’re looking for consistency and predictability, it’s often the structure around them that makes the difference. In this case, it starts with the offensive line.
In the sections below, I’ll break down how line play correlates with fantasy scoring, which metrics matter most, and how to apply that information when drafting in 2026.
Related: 2026 Offensive Line Rankings: 10-1 | 21-11 | 32-22
Relevant Offensive Line Statistics
Below are the core stats I used to create my offensive line metric, which helps rank each team’s unit. Weighted in terms of importance, the final score attempts to measure exactly how much an O-Line will help or hurt a team's fantasy output.
- QB Pressure Rate Allowed – The percentage of passing plays in which the quarterback was hurried, hit, or knocked down.
- Adjusted Sack Rate – From Football Outsiders, “Adjusted Sack Rate, which gives sacks (plus intentional grounding penalties) per pass attempt adjusted for down, distance, and opponent.” My favorite part of this stat is the down and distance bit of the metric, as it weighs a drive-killing sack on 3rd-and-1 more heavily than a 3rd-and-25 sack during a fledgling drive.
- Running Back Yards Before Contact - Just as it sounds, the average amount of yards that a team’s running back group earns before a defender makes contact with them.
- Adjusted Line Yards – Coming from FO again, this formula assigns responsibility to the offensive line to varying degrees depending on the length of a run (0–4 yards, 5–10 yards, 11+ yards, and loss of yardage). Those numbers are adjusted by “down, distance, situation, opponent and the difference in rushing average between shotgun compared to standard formations”.
- Number of Starters – This is simply the number of offensive linemen who were forced into a starting role throughout the season. This makes for a quick reference point for teams that are dealing with injuries or are forced to start a perceived less-talented player for one reason or another.
- Number of Offensive Line Penalties – This incorporates all penalties assessed to offensive linemen on a team, though holding calls and false starts generate a vast majority of the numbers. I’ve decided to include all penalties, whether accepted or declined, as it is not possible to parse out exactly whether a call should have been made (or accepted) without watching each penalty individually. And believe me, we both have better things to do with our time. Though this is not an all-encompassing stat for judging a team’s discipline, it’s important to see which teams have been more likely to kill drives with mistakes.
- Blown Blocks - Sports Info Solutions’ metric for how often a player does not successfully block the defender they attempted to engage. This is represented in the overall metric in terms of percentage; the higher the percentage the team misses a defender, the bigger the detriment to their overall grade.
- Coach Tenure - A numerical representation of how long teams have been able to coach the same types of blocking schemes season-to-season. This is simply how long the offensive line coach has been with the team. Another attempt to quantify continuity.

How This Data Correlates to Fantasy Points
To put these statistics into relevant context, I have graphed each offensive line statistic versus every team’s 2025 total half-PPR points to find the r-squared on a fitted regression line. A table of the full findings follows, but I wanted to include one of the graphs to help explain what this process looks like (and to show my work a little bit).
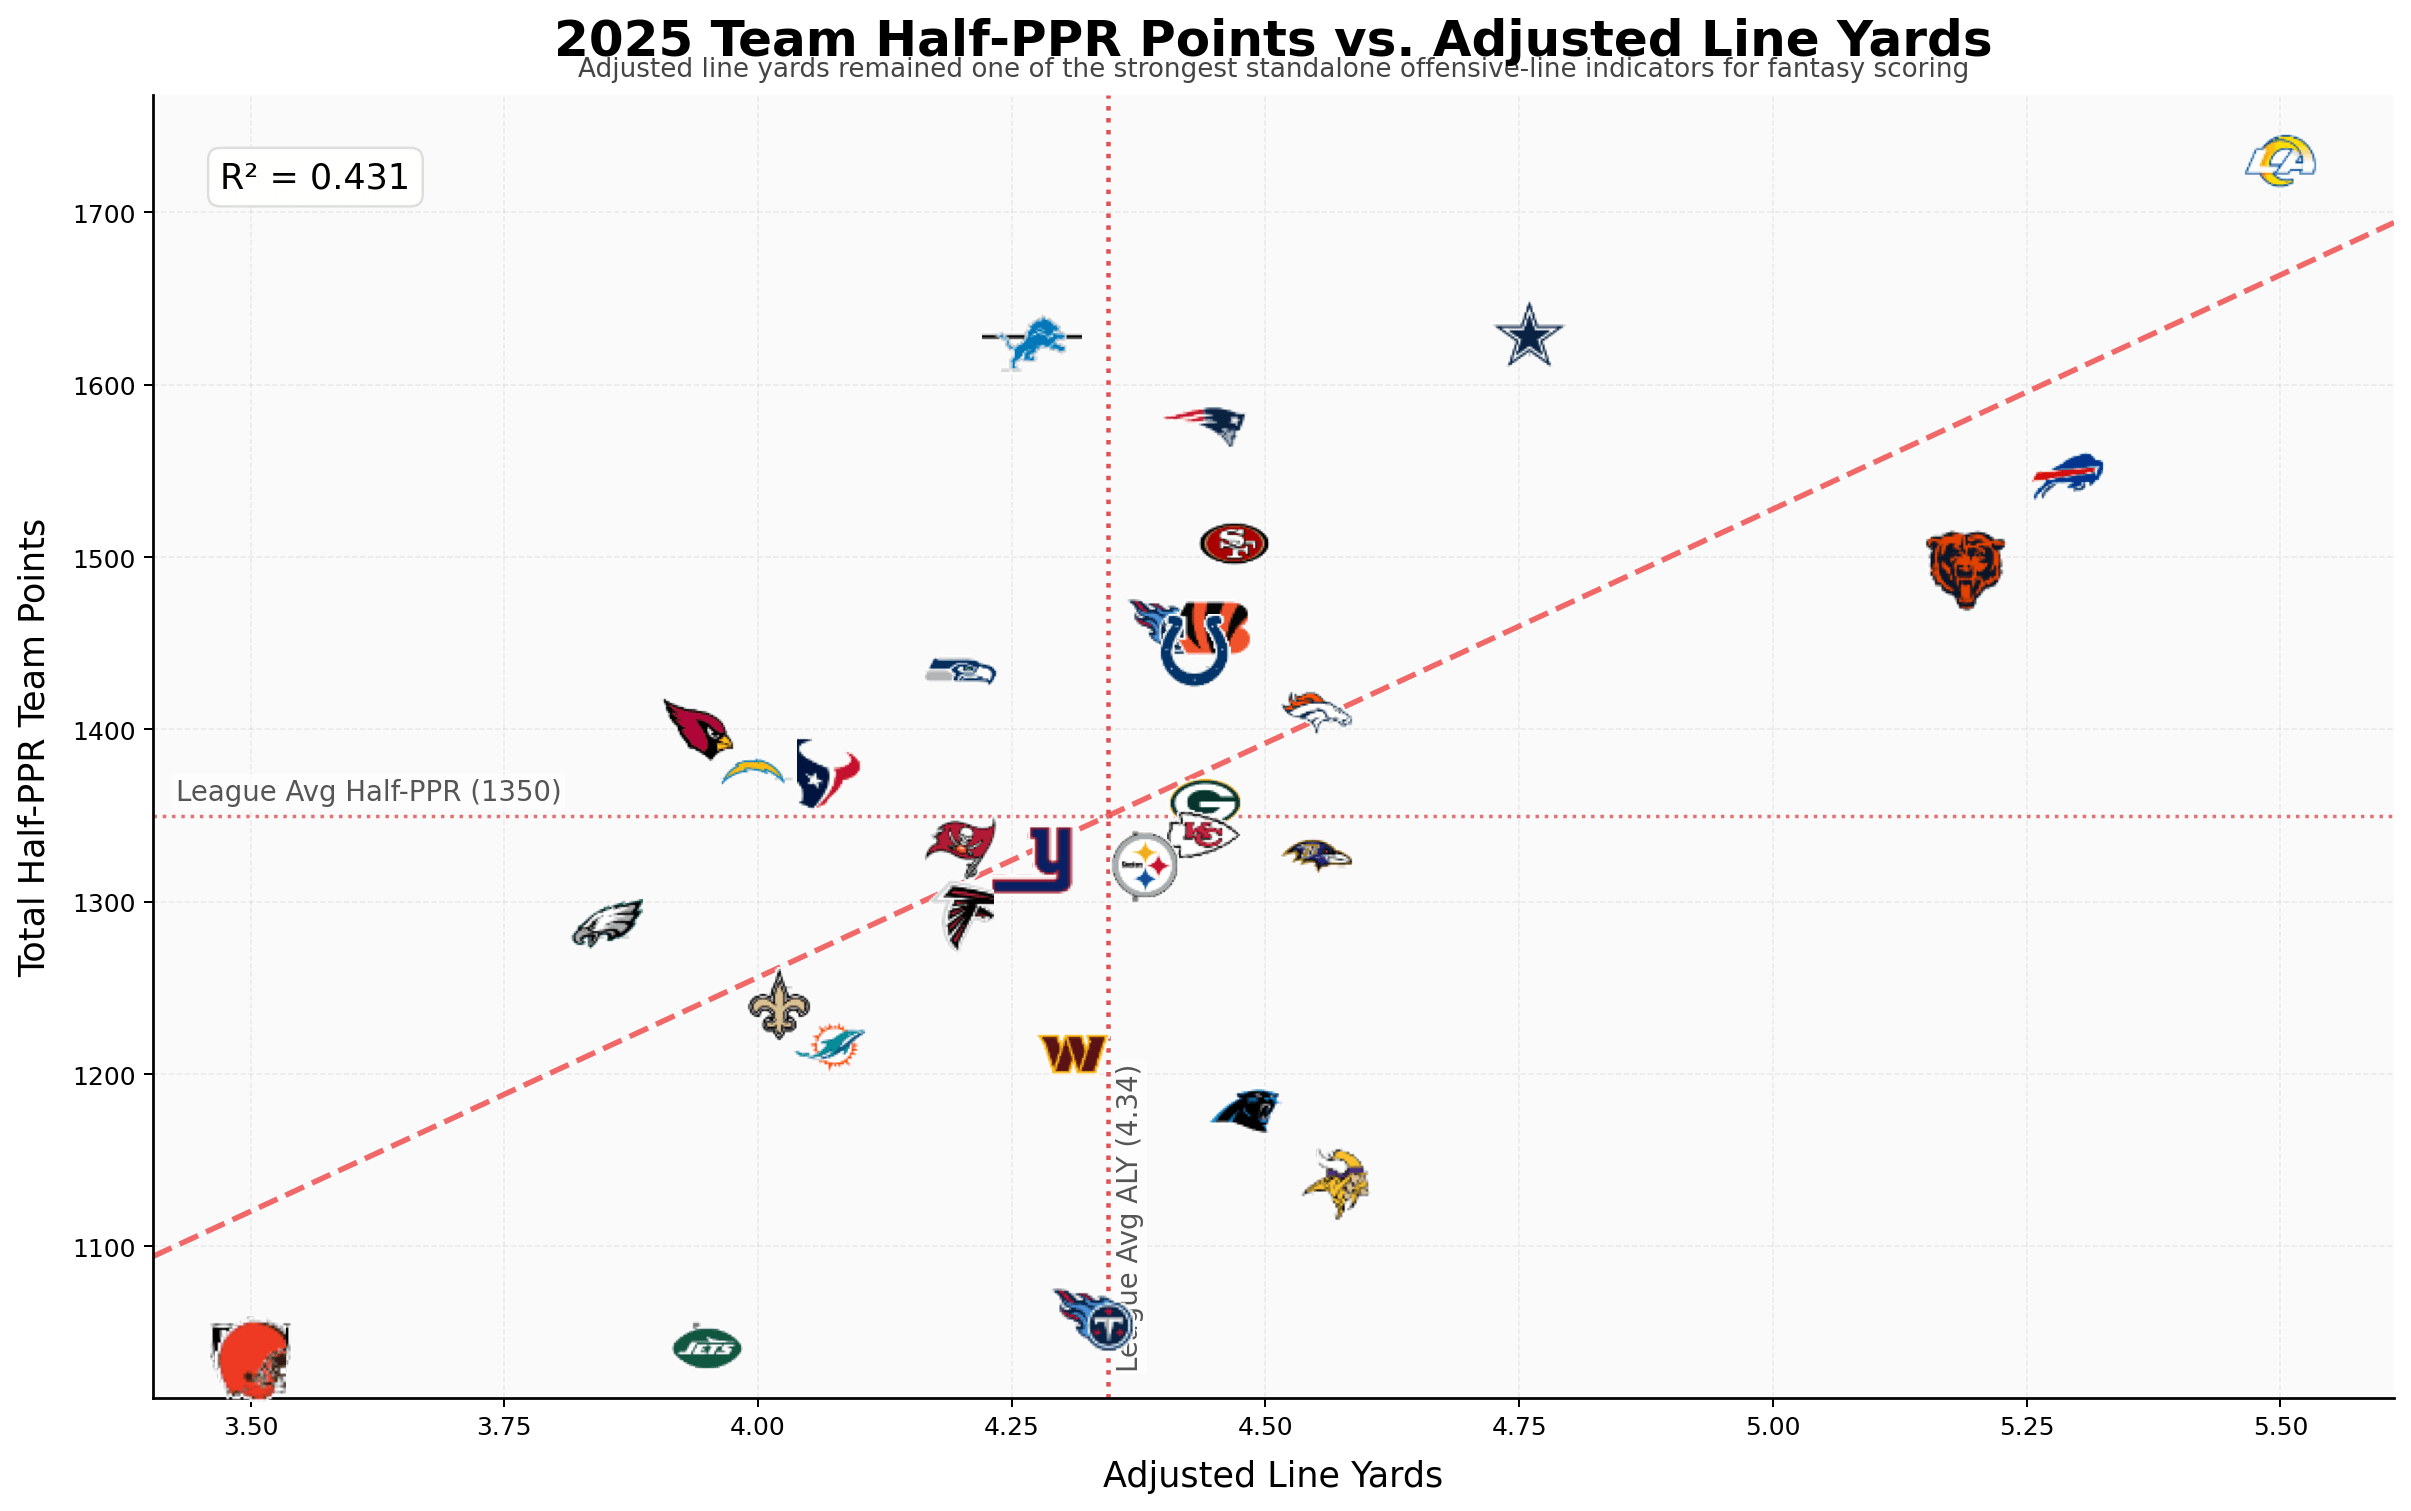
Adjusted Line Yards does a pretty good job on its own in regards to predicting fantasy scoring for an NFL team. It makes sense, as the league's best rushing attacks continue to fuel offenses as defenses have gotten lighter to stop the pass over the last decade or so.
Teams in the upper-right-hand corner were effective at continuing drives on the ground, and this is one reason why teams like the Rams, Bills, and Bears were such fantasy-scoring machines. On the flip side, adjusted line yards also helps in explaining why fantasy pieces for the Raiders, Jets, and Browns were left to rot on our benches.
This would be as good a time as any to clarify that I’m not trying to say that the quality of an O-Line is going to be the end-all, be-all of why teams can/cannot score fantasy points; I just want to illustrate that they are a bigger piece of the puzzle than they are given credit for.
The adjusted line yards metric offered the highest correlation (43.1%) to fantasy points of any of the individual statistics I delved into, but let’s take a look at the rest.
| O-Line Metric | Correlation |
|---|---|
| Adjusted Line Yards | 0.431 |
| Adjusted Sack Rate | 0.384 |
| RB Yards Before Contact | 0.324 |
| Blown Block Rate | 0.245 |
| QB Pressure Rate Allowed | 0.182 |
| # of OL Penalties | 0.114 |
| # of OL Starters | 0.04 |
The "number of starters" is not as well correlated as it has been in years past, but it still makes sense to keep track of, as backup-caliber options logging starter-level snap counts is not typically a great thing for any unit. This can also be explained by both the lack of continuity (see Thomas Emerick’s work on the subject for more on the matter) being detrimental to the unit’s overall performance and the downgrade in talent that nearly always occurs when a backup is forced into that full-time role.
We have some acceptable correlations from this exercise. I would be satisfied knowing that running back yards before contact could explain nearly a third of a team’s fantasy points, or that adjusted sack rate could explain more than a third of a team’s cumulative fantasy output. I think we can make these numbers even more descriptive without actually changing the numbers, but how?
As I’ve often preached, this data and the offensive line work I generally do are better used to identify outlier teams to avoid or attack. Meaning: let’s target teams in the top 10 and avoid those in the bottom 10 for offense, and the opposite for defense. Can we improve these correlations by excluding teams ranked 11th through 22nd in a given metric and focusing instead on the best and worst teams?
| O-Line Metric | Correlation |
|---|---|
| Adjusted Sack Rate | 0.512 |
| RB Yards Before Contact | 0.502 |
| Adjusted Line Yards | 0.494 |
| Blown Block Rate | 0.245 |
| QB Pressure Rate Allowed | 0.225 |
| # of OL Penalties | 0.173 |
| # of OL Starters | 0.06 |
Each of our featured statistics becomes more descriptive when we eliminate the middle of the spectrum to shine the light on the highs and lows of offensive line play. Adjusted sack rate, for example, becomes incredibly strong when we only focus on the best and worst teams in that given metric. But there are still some frayed ends to clean up here. What if we incorporate all of these into a single metric, weighted by statistical importance, and use that to compare against a team’s fantasy production?
What's this all-encompassing metric, and does it correlate well?
| O-Line Metric | Correlation |
|---|---|
| AEOL | 0.462 |
| Adjusted Line Yards | 0.431 |
| Adjusted Sack Rate | 0.384 |
| RB Yards Before Contact | 0.324 |
| Blown Block Rate | 0.245 |
| QB Pressure Rate Allowed | 0.182 |
| # of OL Penalties | 0.114 |
| # of OL Starters | 0.04 |
When I weigh all the metrics I use into a single model, it becomes stronger than any single number and becomes the first piece of the puzzle I use when ranking offensive line units in-season, week to week.
Now let’s take a look at our weighted metric when comparing only the top-10 and bottom-10 units.
| O-Line Metric | Correlation |
|---|---|
| AEOL | 0.591 |
| Adjusted Sack Rate | 0.512 |
| RB Yards Before Contact | 0.502 |
| Adjusted Line Yards | 0.494 |
| Blown Block Rate | 0.245 |
| QB Pressure Rate Allowed | 0.225 |
| # of OL Penalties | 0.173 |
| # of OL Starters | 0.06 |
As we already saw, all of these metrics become stronger when focusing on the top-10 and bottom-10 in that given category, and the AEOL follows the same path. The AEOL metric helped explain almost three-fifths of the fantasy points scored by the league's top and bottom offensive line units. Someone still has to touch the ball to get sacked, or get hit behind the line, or miss the gap that has been blocked for them, but I’ve chosen these statistics due to how well I believe they do a very difficult task —separate offensive line play from a team’s skill position players.
By adding context (film watching, injuries, competition, etc.) to this strong baseline, we now have a formula that can lead us toward fantasy options on good-blocking teams and away from poor offensive environments.
There are outliers, and there will always be outliers, but it doesn’t mean we can’t use offensive line play as another data point when deciding on who to roster and play.
Further Reading
A (very reasonable) question I’ve received a lot in the past is how (or if) we can separate my offensive line research into buckets of rushing and passing. While a very valid inquiry (and one I’m not apt to give up on any time soon), the short answer is “no.” For the time being, I believe this metric and the rankings that will come from it are best viewed in an environmental context. Good offensive lines equal a good environment for increased yardage and are less likely to allow drives that stall into punts and field goals.
Once we get into massive, lengthy rankings articles, there will be a lot to parse out, and some offensive linemen are objectively better in pass protection than they are in run-blocking. That information often comes wholly from the eye test, so you’ll just have to keep your eye on the 4for4 front page as offensive line content continues through the summer.
Bottom Line
- By strengthening the offensive line, NFL teams create ripe situations for fantasy production.
- No single statistic can explain all of a team’s output, but if we weigh the important ones, we get a better idea of how much they influence a skill position player's stock.
- Providing context and ranking all 32 units will give us an advantage over fantasy managers who ignore this vital piece of the pie.