TJ's #Taek: Week 10 NFL DFS Recap

Week 10’s winning lineups from the biggest contests on FanDuel and DraftKings can be used to tease out lineup-building strategies and offer clues on how you could have landed on a similar team. Reviewing your hits and misses each week is imperative if you want to be a profitable DFS player but examining winning lineups is also a useful exercise in cultivating a winning approach.
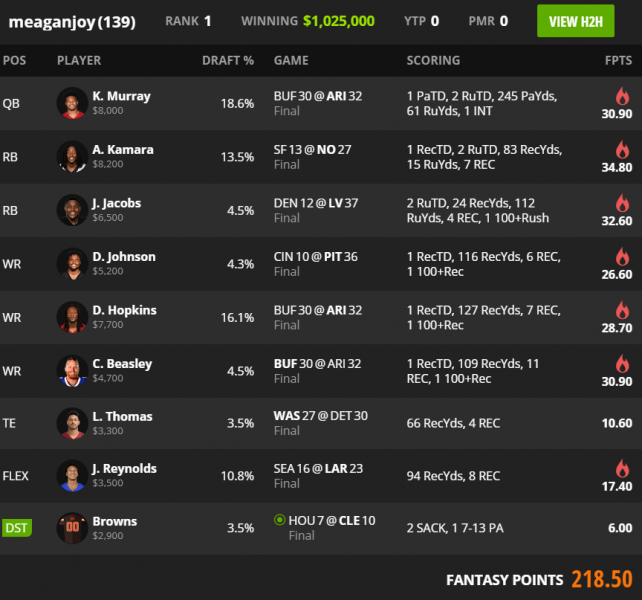
DraftKings Week 10 Millionaire Winning Lineup

Week 10’s winning Millionaire lineup had five players who were in fewer than 5% of lineups and no player in more than 20% of lineups, resulting in an average ownership of 8.8%, the second-lowest of any Millionaire winner in 2020. While this lineup did include three players from one game, there were no secondary correlations, making it the second time this season and in as many weeks that the winner had fewer than four correlated players.
This lineup turned the most popular lineup build upside down. There was heavy ownership on cheap running backs but this lineup paid up at the position and implemented a stars-and-scrubs approach with cheap pass-catchers.
What Were the Indicators for the Low-Owned Plays?
Avoiding the cheap, chalk running backs was sure to lead to a contrarian lineup build, but Josh Jacobs was in a unique pricing tier himself. The Raiders were the fourth-biggest favorite on the slate but sentiment was low on Jacobs with his touch share waning. Still, he was the starting back on a significant favorite with a relatively high team total.
Cole Beasley made sense as an alternative to the popular pass-catchers in the Cardinals-Bills game and as a low-owned, low-salary piece to offset the popular, expensive, Murray/Hopkins stack. Even with John Brown back in Week 9, Beasley played over two-thirds of the snaps and going into Week 10, Beasley led the Bills in targets inside the 10.
The Steelers had a great on-paper matchup against the Bengals but with Ben Roethlisberger not practicing all week because of COVID concerns and heavy winds expected in Pittsburgh, ownership was down across the board on the Steelers. Going into Week 10, Diontae Johnson had seen at least 10 targets in three of the four games that he’s played at least 70% of snaps. With a moderate average target depth, his volume was likely to continue despite wind concerns.
Logan Thomas didn’t have a big game but we’ve used this space before to point out that you don’t have to be perfect across the board to win even the biggest tournaments. Especially at a volatile position like tight end, rostering a low-salary player in order to fit in another stud often offers more upside than rostering to mid-level players, even if the low-salary player doesn’t have a monster game.
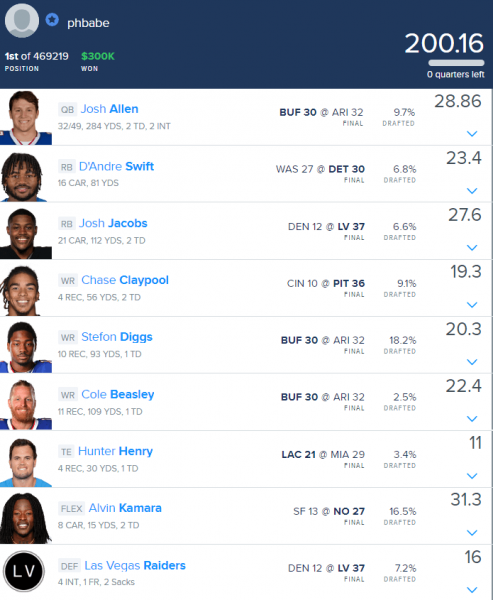
FanDuel Week 10 Sunday Million Winning Lineup

Sunday marked the first time since at least the beginning of the 2019 season that the Sunday Million winning lineup had an average ownership below 9%. Besides using just two roster spots on players in at least 10% of lineups, this roster left $400 of salary on the table—only one winner this year has left more than $200 of salary unused and that was likely because of a late swap scenario.
D’Andre Swift was a great pivot off of chalk running backs Mike Davis and Duke Johnson, as Swift had seen his touch share rise above 50% in recent weeks. With Swift’s work in the passing game, there were indicators that his workload would only increase, as noted on last week’s DFS MVP podcast.
Hunter Henry graded out as a top-six value play at tight end in a week where the options were thin at best. Not only was Hunter a price pivot off of Dallas Goedert, but was a leverage play off his chalk teammate Keenan Allen, who had a good but nor great day.
TJ’s Final #Taek
In this space last week, I mentioned how important it is to make sure we use relevant data in our weekly research, especially with season-long numbers since that landscape of football shifts so dramatically from Week 1. For fantasy purposes, one of the most important things we can know about an offense is whether they want to run or pass.
One of the best indicators of a team’s intentions is how they act in neutral game script, or when the game is within a single score. The following data shows neutral passing rates for every team over the first five weeks of the season and how the data looks over the last five weeks. Keep these numbers in mind when you inevitably hear any mention of season-long rates moving forward.
| Team | Neutral Pass %, Weeks 1–5 | Neutral Pass %, Weeks 6–10 | Difference |
|---|---|---|---|
| LAC | 50.0% | 60.9% | +10.9% |
| LAR | 52.9% | 62.0% | +9.1% |
| PIT | 59.2% | 66.7% | +7.4% |
| DEN | 54.9% | 61.9% | +7.0% |
| CHI | 58.7% | 64.3% | +5.6% |
| CAR | 57.1% | 62.2% | +5.1% |
| WAS | 58.7% | 63.8% | +5.0% |
| TEN | 51.7% | 56.7% | +5.0% |
| MIN | 44.1% | 47.3% | +3.2% |
| IND | 57.3% | 60.4% | +3.1% |
| CIN | 62.6% | 65.3% | +2.7% |
| NYJ | 56.0% | 58.0% | +2.0% |
| SEA | 63.4% | 64.1% | +0.7% |
| GB | 58.3% | 58.7% | +0.4% |
| TB | 61.2% | 61.4% | +0.2% |
| DET | 58.5% | 58.1% | -0.4% |
| PHI | 61.2% | 60.8% | -0.4% |
| NO | 57.9% | 57.2% | -0.7% |
| KC | 61.7% | 61.0% | -0.7% |
| LV | 50.5% | 48.7% | -1.7% |
| JAX | 57.8% | 55.9% | -1.9% |
| BUF | 62.0% | 59.8% | -2.2% |
| NE | 49.5% | 45.6% | -3.9% |
| ARI | 53.8% | 49.5% | -4.4% |
| MIA | 59.5% | 54.0% | -5.4% |
| ATL | 61.3% | 55.1% | -6.2% |
| CLE | 51.8% | 45.5% | -6.3% |
| BAL | 51.8% | 45.1% | -6.7% |
| HOU | 64.9% | 56.5% | -8.4% |
| NYG | 63.2% | 54.3% | -8.9% |
| DAL | 63.9% | 53.5% | -10.5% |
| SF | 61.4% | 49.7% | -11.7% |


