GPP Leverage Scores: Balancing Value with Ownership in DFS

To fade, or not to fade, that is the question. How does projected ownership affect player value in a tournament? And how can projected ownership and projected value be used to determine the optimal amount of exposure you should have to each player?
For example, if LeVeon Bell is the top-projected RB play on the slate but projects to be owned in 30% of lineups, to what degree does that negate his value? Should you completely fade him? Own him in 30% of your lineups too? Or even more than that?
By the same token, if Isaiah Crowell has a merely decent fantasy point projection but is expected to garner sub-5% ownership, how much does that increase his value, and what should your exposure to him be?
In response to questions such as those, I created a metric called GPP Leverage Score.
For this week's GPP Leverage Scores, click here.
What Is GPP Leverage Score and How Is It Calculated?
GPP Leverage Score is a metric that adjusts for the effect of ownership percentage on a player's tournament value. It can be used to compare the tournament value of different players, determine optimal exposure relative to the field for a given player, or determine optimal exposures for a group of players in a given player pool.
Calculating GPP Leverage Score involves a three-step process:
1. Find the odds of each player being a tournament-winning play. This takes into account a player's projected points, salary, position, and projected volatility (floor/median/ceiling), along with historical data on the number of points needed to win tournaments relative to position and salary.
2. Calculate an implied ownership percentage for each player. This is essentially what a player's ownership should be when taking into account his odds of being a tournament-winning play relative to that of all other players at his position.
3. Compare implied ownership with projected ownership. This outputs GPP Leverage Score, which indicates the degree by which you should be overexposed or underexposed to a player. A GPP Leverage Score greater than 1 indicates there is more leverage in having higher exposure to a player than the field does, while a GPP Leverage Score less than 1 indicates there is more leverage in having less exposure to a player than the field does, which is of course commonly referred to as "fading" the player.
Below I'll walk through each step of the calculations, and more importantly, show you how to use GPP Leverage Score to gain an edge by determining which players have the greatest upside once projected ownership is taken into account. I'll also show you how to use GPP Leverage Score to determine optimal player exposure.
Finding the Odds of Being a Tournament-Winning Play
To find the odds of a player being a tournament-winning play, we first need a target score to aim for.
It's important not to target a linear multiplier such as 3x (3 points per $1,000) on FanDuel to hit 180 points or 5x (5 points per $1,000) on DraftKings to hit 250 points because linear multipliers fail to account for the unique scoring expectation of each position and salary range.
Instead, I ran a regression to find the relationship between fantasy points and salary for players at each position in first-place lineups in the DraftKings Millionaire Maker and FanDuel Sunday Million tournaments, which are both large-field tournaments where the interplay of ownership and value is of utmost importance. Below is a sampling of what the target scores look like at each position at various salary ranges:
| FD Sal ($) | QB | RB | WR | TE | D |
|---|---|---|---|---|---|
| $4,500 | 24.5 | 22.4 | 17.1 | 17.1 | |
| $6,000 | 27.9 | 25.5 | 23.6 | 18.7 | |
| $7,500 | 28.8 | 26.5 | 24.7 | 20.3 | |
| $9,000 | 29.7 | 27.4 | 25.9 | 21.9 | |
| Avg. FDP | 29.0 | 26.2 | 24.2 | 18.4 | 18.4 |
| Avg. Sal | $8,109 | $7,149 | $7,344 | $5,918 | $4,679 |
| DK Sal ($) | QB | RB | WR | TE | D |
|---|---|---|---|---|---|
| $3,000 | 28.0 | 26.8 | 24.0 | 15.3 | |
| $5,000 | 31.2 | 29.0 | 28.1 | 26.3 | |
| $7,000 | 32.2 | 30.0 | 29.4 | 28.6 | |
| $9,000 | 33.2 | 31.1 | 30.7 | ||
| Avg. DKP | 32.0 | 29.5 | 28.7 | 25.4 | 15.2 |
| Avg. Sal | $6,359 | $5,664 | $6,212 | $4,563 | $3,144 |
Note how small the range is between the target scores for the highest and lowest salaries at each position. This reinforces how aiming for a linear multiplier can lead to errant decision making.
For example, even though a point total of 29.5 and a salary of $5,664 equates to a multiplier of 5.21 points per $1,000 for a DraftKings RB, one who costs $3,000 would need a multiplier of 9.33 to reach its target of 28.0 points; using 5.21 would result in only 15.6 points—12.4 short of the target. In fact, you'd be better off targeting a static value, such as the average score, than targeting a linear multiplier.
Once we have the target scores we can calculate each player's probability of hitting it. To do this, I use a normal distribution calculation, which calculates the probability that a given value will occur when given mean and standard deviation. For each player's mean, I use his projected points, and since the 4for4 floor and ceiling projections fall roughly one standard deviation from the mean, I use the average distance between each of them and projected points as standard deviation.
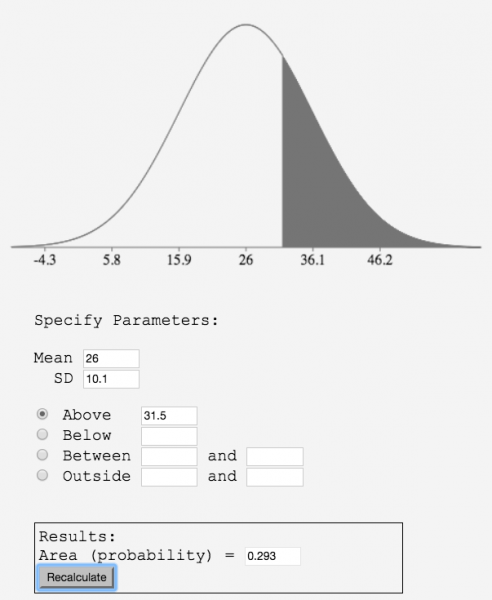
For example, at a DraftKings salary of $9,800, LeVeon Bell's GPP target score is 31.5 points. As of this writing, his floor/mean/ceiling projections are 11.7/26.0/31.9. Thus, 26.0 would be his mean and the standard deviation would be 10.1 (31.9 minus 11.7 divided by 2), which results in a probability of 29.4%.
For those more visually inclined, here's how it looks using onlinestatbook.com's normal distribution calculator:
The great thing about using the 4for4 projections is that the projected floors and ceilings are driven by the exceptional accuracy of the median projections, and instead of just applying historical positional volatility rates to the median projections to calculate floor and ceiling, we also adjust for our own projection accuracy at each position. For example, just because the average TE's weekly fantasy point totals deviate 70% from the mean doesn't mean we simply make every TE's floor 70% lower than the mean projection and every TE's ceiling 70% higher than mean projection. Instead, we also incorporate how far a TEs' actual point total deviate from our projections, which is usually less because we can predict the direction of the deviation with a certain degree of accuracy. This allows us to more precisely project a range of outcomes for each player, which in turn makes players' projected odds of hitting a given point total more accurate.
Calculating Implied Ownership
If you read enough DFS articles you'll inevitably come across a statement like "player x is projected to be in five times as many lineups as player y, but player x is not five times more likely to hit his ceiling than player y, so you should target player y and fade player x." Calculating implied ownership essentially quantifies that line of thought.
To calculate a player's implied ownership, sum the odds of all players at a given position and divide that player's projection into the total.
For example, the odds of all RBs hitting their target score on DraftKings in a given week might sum up to 190.8%, so Bell's 29.3% odds account for a whopping 15.4% of the total. That means that based on Bell's projected outlook, he should account for 15.4% of all RB ownership. This can be now be converted to implied ownership by multiplying it by total projected RB ownership, which is 240.5% as of this writing (we project player ownership in ranges; 240.5 represents the median of the projected ranges), for a result of 37.0%.
Calculating GPP Leverage Score
To calculate GPP Leverage Score, simply divide implied ownership by projected ownership.
Staying with the example of Bell, his projected ownership range is 30%–35%, so you would use the median, 32.5%, as his projected ownership. The 37% implied ownership divided by the 32.5% projected ownership equals a GPP Leverage Score of 1.14, suggesting the optimal way to leverage exposure to Bell is by owning him 1.14 times, or 14%, more than the field.
Here's how Bell's GPP Leverage Score compares to the other three players priced $8,500 and above on DraftKings in the example:
| Pos | Player | Team | Opp | Price | Floor | Med | Ceil | Proj Own% | Tar Prob% | Imp Own % | LEV |
|---|---|---|---|---|---|---|---|---|---|---|---|
| RB | LeVeon Bell | PIT | @CLE | $9,800 | 11.7 | 26.0 | 31.9 | 32.5% | 29.3% | 37.0% | 1.14 |
| RB | David Johnson | ARI | @DET | $9,400 | 9.6 | 23.2 | 29.8 | 32.5% | 21.2% | 26.7% | 0.82 |
| WR | Antonio Brown | PIT | @CLE | $8,800 | 8.3 | 20.8 | 29.5 | 22.5% | 17.9% | 18.0% | 0.80 |
| WR | Julio Jones | ATL | @CHI | $8,500 | 8.3 | 19.6 | 28.6 | 22.5% | 14.5% | 14.6% | 0.65 |
As you can see, Bell is the only one for whom it would be optimal to be overexposed to relative to the field. Generally, RBs will have higher GPP Leverage Scores than WRs because there are more options at WR.
Before we get into how to use GPP Leverage Scores to determine player exposure, I want to point out that Bell's GPP Leverage Score being above 1 despite high projected ownership flies in the face of the notion that you should "auto-fade" every player with high projected ownership.
On the contrary, 88% of first-place Millionaire Maker lineups over the past two years contained at least one player with ownership of 25% or more, with 63% of those lineups containing at least one player with ownership of 30% or more.
Chalk is best dealt with on a case-by-case basis, hence GPP Leverage Score.
Using GPP Leverage Scores to Determine Player Exposure
GPP Leverage Score is expressed with a base of 1 for ease of decipherability (e.g., a score of 8.00 means optimal exposure is eight times as much as the field) and for ease of player comparison. But if you haven't already noticed, GPP Leverage Score in its raw form calculates optimal exposure assuming partial ownership of every player on the slate, so to determine optimal exposure for a smaller player pool, we'll have to weight it.
Before I get into how to do that, note that if you just want a quick and dirty method for determining exposure to a few key players, you can use implied ownership for those players only and set the rest of your other exposures as you see fit. For example, if you were only worried about how to deal with exposure to Bell and Johnson chalk on DraftKings, you could deliberately set lineups to end up with ~37% exposure to Bell and ~27% exposure to Johnson while letting your other exposures fall into place as they may.
If you prefer to methodically determine most or all of your player exposures based on leverage, however, you would need to use weighted version of GPP Leverage Score based on the players contained in your player pool.
Let's say you have a player pool of six RBs you want to use on DraftKings. For ease of calculation, let's also suppose that you don't plan on using any RBs in the FLEX, so your total RB ownership would add up to 200%. To calculate optimal player exposure, sum up the players' GPP Leverage Scores and divide each one into the sum to get total exposure out of 100%, then multiply by 2 to get total exposure out of 200%:
| Player | LEV | Weighted Exp |
|---|---|---|
| Isaiah Crowell | 2.38 | 71% |
| LeVeon Bell | 1.14 | 34% |
| Lamar Miller | 1.04 | 31% |
| Bilal Powell | 0.96 | 29% |
| Jay Ajayi | 0.69 | 21% |
| Ameer Abdullah | 0.45 | 14% |
| SUM | 6.66 | 200% |
Of course, not everyone is comfortable going with 71% exposure to any player, let alone a Browns RB. In that case, you would decide on a cap that you're comfortable with and recalculate exposure. Let's say you want to cap exposure at 50% in the previous example; you would set Crowell's exposure to 50%, then sum the other five GPP Leverage Scores and follow the same process as before, except you would be weighting the other five RBs for 150% exposure instead of 200% since 50% is already accounted for. What results is a flatter exposure portfolio:
| Player | LEV | Weighted Exp |
|---|---|---|
| Isaiah Crowell | 2.38 | 50% |
| LeVeon Bell | 1.14 | 40% |
| Lamar Miller | 1.04 | 36% |
| Bilal Powell | 0.96 | 34% |
| Jay Ajayi | 0.69 | 24% |
| Ameer Abdullah | 0.45 | 16% |
| SUM | 6.66 | 200% |
One thing to keep in mind is that selecting players for your player pool based on leverage alone may leave you below salary requirements, which is why I allude to selecting a player pool first. Leaving too much salary on the table generally hasn't been a winning strategy: 58% of first-place lineups over the past two years in the Sunday Million and 41% in the Millionaire Maker left salary on the table, but only 21% of Sunday Million lineups and 9% of Millionaire Maker lineups left more than $300 on the table. Therefore, perhaps the most practical way to use GPP Leverage Score is to select a player pool for each price range (regardless of position) and then use GPP Leverage Score to set exposure, starting with the highest salary tier. If you're looking for general high-salary benchmarks, 94% of first-place lineups in the Sunday Million had at least two players priced $7,700+ and 94% of first-place lineups in the Millionaire Maker had at least two players priced $6,800+. But let's say you actually want your exposure from the highest salary tier to come from a player pool of the top seven highest salaried players on DraftKings. Since you want to get two of those players in your lineup, you would again weight each player's GPP Leverage Score for total ownership of 200%. Below is what exposure would look like, both uncapped and with a 50% ownership cap:
| POS | Player | Salary | LEV | Weighted Exp | Weighted Exp (Cap 50%) |
|---|---|---|---|---|---|
| RB | LeSean McCoy | $8,200 | 2.76 | 60.5% | 50.0% |
| WR | Odell Beckham | $8,300 | 1.80 | 39.5% | 42.3% |
| RB | LeVeon Bell | $9,800 | 1.14 | 25.0% | 26.7% |
| RB | David Johnson | $9,400 | 0.82 | 18.0% | 19.3% |
| WR | Antonio Brown | $8,800 | 0.80 | 17.6% | 18.9% |
| WR | A.J. Green | $8,000 | 0.71 | 15.7% | 16.8% |
| WR | Julio Jones | $8,500 | 0.65 | 14.3% | 15.3% |
| WR | Mike Evans | $7,800 | 0.43 | 9.5% | 10.2% |
Once you've got your upper salary tier exposure squared away, it should be easier to optimize the rest of your lineup by leverage. If you want to further compartmentalize, you can also cap your exposure to players below a certain salary threshold. What's a good threshold? Over the past two seasons, 91% of first-place Sunday Million lineups had at least two players at RB/WR/TE priced below $6,600 and 84% of first-place Millionaire Maker lineups had at least two players at RB/WR/TE priced below $5,300; 44% of the Sunday Million lineups and 41% of the Millionaire Maker lineups had three or much such players. That means you can cap your total ownership to players below each respective salary threshold somewhere in the 230%–250% range and weight exposure accordingly.
Ultimately, the great thing about GPP Leverage Score is you can use it in a variety of ways to suit your individual DFS playing style. For example, you can use GPP Leverage Score to determine optimal exposures for a pre-existing player pool of any size at any salary range, or to help with selecting a player pool in the first place. And when setting exposures, you can use GPP Leverage Score as a loose guide or precise determinant, for one player or your entire player pool, and with or without a capped exposure ceiling. Or you can simply use GPP Leverage Score to decide on a few key plays and fades, a la the Pareto principle.
GPP Leverage Scores will be published every week for 4for4 DFS subscribers. Not a subscriber yet? Sign up now!


