Scott Fish Bowl 16 Rankings and Draft Strategy

It’s the best time of the year…Scott Fish Bowl season! Let’s dig into this year’s scoring system before showing our rankings powered by 4for4’s season-long projections.
Starting with the basics, you get 6 points for all TDs and 2 points per 2-point conversion. You get 0.04 points per passing yard and 0.10 points per rushing or receiving yard. You get 0.5 points per rushing or receiving first down. In addition, you get 0.5 points per reception. On top of that, TEs get an additional point per reception and an additional point per first down.
Editor's Note: SFB16 RANKINGS HERE
Now, things get slightly more complicated. The biggest twist this year is the addition of bonuses. You get 10 bonus points for the following things: 300+ yards passing, 400+ yards passing, 40+ yard passing plays, 100+ yards rushing/receiving, 200+ yards rushing/receiving, 40+ yard rushing plays, and 20+ yard receiving plays.
These bonuses are tough to factor into rankings/projections because they occur infrequently. What I ultimately did was take the rate of games/plays where a player hit those bonuses last season and plugged them into our projections for this season. For rookies or players who were injured last year, I used the average rates for players with at least eight games played last season.

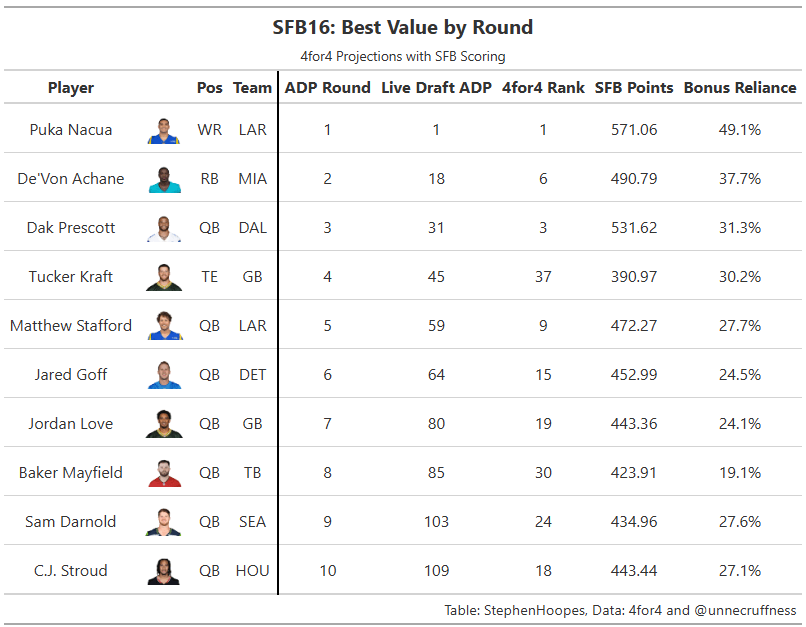
There are obvious problems with this approach. If a player had a fantastic rate of catching 20+ yard receptions last year, as an example, their SFB projection is going to be boosted. In order to be transparent about this, I’ve included a ‘Bonus Reliance’ column in the rankings. It shows what percentage of each player’s projected points are coming via bonus. So, you can target or fade players based on their bonus reliance, however you’d like.
Speaking of the rankings, they are not adjusted for positional scarcity because you don’t have to play any specific position. Your only limitation is a maximum of two QBs. With all of that in mind, the table below shows our current best values by round based on Live Draft ADPs from Unnecessary Ruffness. And the top 150 projections are included in a Google Sheet here. Please download the table, rather than share it.
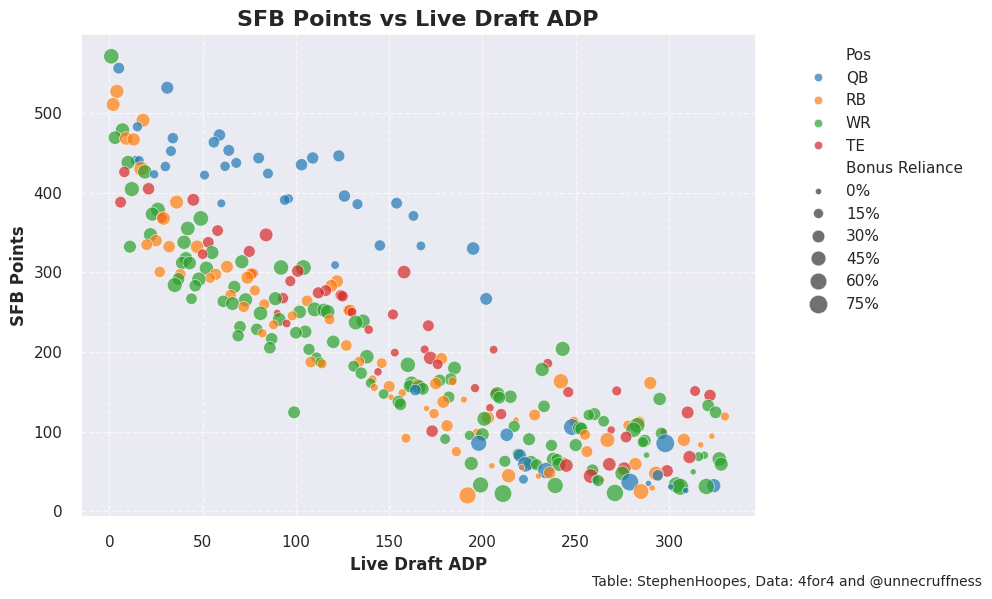
To me, the best way to use projections is as a means to see what positions are available to you later in the draft. The graph below shows current ADP on the x-axis and our projected points on the y-axis. What you’ll notice is that there are a lot of blue dots at the top of the graph spanning all of the ADPs. That means QBs are consistently the best value throughout the draft. That’s why seven of the 10 players in the best value table above were QBs.
Don’t get me wrong. I love Josh Allen. But I think he’s the wrong pick at the 1.05 if these ADPs hold as the live drafts continue. You’re sacrificing players at RB/WR/TE that are simply not available later in the draft. But that’s it for now! I’ll be updating the projections and ADP periodically as live drafts continue. Reach out to me on Bluesky with any questions and donate to Fantasy Cares if you’re able to do so!