FFPC Strategy: Roster Construction

The 2021 season is already underway. Best-ball lobbies over at FFPC opened shortly after the Super Bowl and the race to draft the fantasy MVPs of the 2020 season is in full effect. Early looks into ADP are riddled with recency bias. Travis Kelce is being drafted in the Top 5 overall. Stefon Diggs is now an early second-round pick. Draft values largely reflect how the previous season ended, but overall roster construction is still critical to our success in this format.
Roster construction defines the number of players selected at each position. It’s mostly intuitive. For example, you wouldn’t spend five picks on a 'onesie' position (i.e., a roster spot requiring just one player each week) since you need more at running back or wide receiver. But roster construction is also directly connected to opportunity cost. ‘When’ a position gets drafted has as much importance as the position itself.
I provided some tips and strategies on roster construction for non-SuperFlex leagues around this time last year. It was geared towards the 2020 season, but some of the findings are evergreen. We should be able to apply them year after year. With another season’s worth of data, I compared the trends from the 2020 season to the conclusions found from the previous season. The key takeaways across both years are then used to determine what the optimal strategy should be heading into the 2021 season.
Roster Construction of Winning Best Ball Teams
The 2020 season was unlike any other. It was the first to feature at least one game every day of the week. However, filtering through all the chaos allows us to see what worked for best-ball drafters last year.
| Rank | % of Winning Rosters | QB | RB | WR | TE | DF | PK |
|---|---|---|---|---|---|---|---|
| 1 | 12.01% | 3 | 7 | 8 | 4 | 3 | 3 |
| 2 | 5.41% | 3 | 6 | 9 | 4 | 3 | 3 |
| 3 | 4.35% | 3 | 7 | 9 | 3 | 3 | 3 |
| 4 | 3.96% | 3 | 8 | 8 | 3 | 3 | 3 |
| 5 | 2.70% | 4 | 7 | 7 | 4 | 3 | 3 |
| 6 | 2.51% | 3 | 7 | 7 | 5 | 3 | 3 |
| 7 | 2.37% | 3 | 7 | 9 | 4 | 2 | 3 |
| 8 | 2.31% | 3 | 8 | 7 | 4 | 3 | 3 |
| 9 | 1.78% | 3 | 8 | 9 | 4 | 2 | 2 |
| 10 | 1.78% | 3 | 8 | 8 | 4 | 2 | 3 |
For the experienced FFPC drafters, there aren’t any surprises here. A semi-balanced approach to running backs and wide receivers, with a deference to the pass catchers, was used in 58.3% of the Top 12 roster constructions. At least three quarterbacks and tight-ends were drafted in each build. A majority of winning rosters drafted three defenses and kickers. Fantasy gamers new to the format can use these numbers as roster limits for each position. However, the critical component is the opportunity cost required for each draft pick.
Early Rounds
Rounds 1-6 set up your entire draft. Running backs and wide receivers dominate the picks with early shots at tight-end (given the premium scoring format) and quarterback. Strategies on what to do with the middle and later rounds of the draft are being formed. But while the draft may seem chaotic with elite talent flying off the board, there’s still an optimal structure that we can use.
| Rank | % of Winning Rosters | QB | RB | WR | TE | DF | PK |
|---|---|---|---|---|---|---|---|
| 1 | 13.13% | 0 | 3 | 2 | 1 | 0 | 0 |
| 2 | 11.61% | 0 | 2 | 3 | 1 | 0 | 0 |
| 3 | 10.88% | 0 | 3 | 3 | 0 | 0 | 0 |
| 4 | 6.73% | 1 | 2 | 2 | 1 | 0 | 0 |
| 5 | 6.60% | 0 | 2 | 4 | 0 | 0 | 0 |
| 6 | 5.61% | 0 | 4 | 2 | 0 | 0 | 0 |
| 7 | 5.47% | 1 | 3 | 2 | 0 | 0 | 0 |
| 8 | 4.95% | 1 | 3 | 1 | 1 | 0 | 0 |
| 9 | 4.75% | 1 | 2 | 3 | 0 | 0 | 0 |
| 10 | 4.22% | 0 | 2 | 2 | 2 | 0 | 0 |
| 11 | 3.69% | 0 | 4 | 1 | 1 | 0 | 0 |
| 12 | 3.56% | 0 | 3 | 1 | 2 | 0 | 0 |
I used the same process when studying the results of the 2019 season. At the time, the takeaways were specific to that season. Now, we can compare the trends across the last couple of seasons to make stronger conclusions. I pulled the main points from the previous article and used the 2020 data to support the finding.
One finding from 2019 noted that the optimal early-round strategy required a balance between running backs and wide receivers. The 2020 results indicate this is true. In fact, the tendencies across both seasons are nearly identical.
| Rank | % of Winning Lineups | QB | RB | WR | TE | DEF | K |
|---|---|---|---|---|---|---|---|
| 1 | 19.50% | 0 | 3 | 2 | 0 | 0 | 0 |
| 2 | 14.50% | 0 | 2 | 3 | 0 | 0 | 0 |
| 3 | 12.40% | 0 | 3 | 3 | 0 | 0 | 0 |
The Top 3 early-round constructions in FFPC (non-slim) leagues were exactly the same in both 2019 and 2020. While their usage rates differed, the main point of balancing your exposure across the positions is clear. It’s not to say strategies like ‘ZeroRB’ or ‘RobustRB’ can’t work. But drafters must maintain an understanding of opportunity cost when bypassing other positions early in the draft.
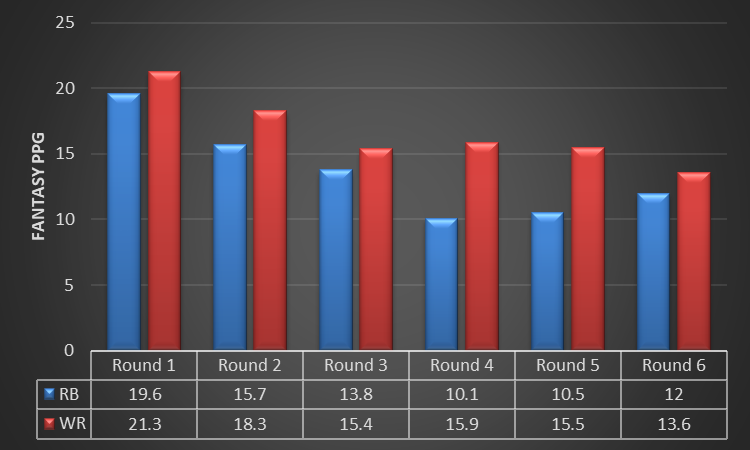
It shouldn’t come as a shock, but finding productive running backs outside of the first few rounds is difficult. The short supply forces some to pivot to a wide receiver (or tight end). It causes others to draft more running backs and forego an elite wide receiver. Agnostic of draft slot, a balanced approach provides the most flexibility. It's conducive to capturing top production across each position and doesn’t significantly alter your strategy for the middle rounds. I typically apply this approach unless extreme circumstances happen during the draft (e.g., a player falls well past their ADP).
Another finding from 2019 denoted that drafting at least one tight-end early was an optimal approach. The 2020 results indicate this was also true. The TE-premium scoring format boosts the ADP of early-round TEs by nearly a full round compared to traditional PPR formats. It gives drafters the illusion of supply, but the results don’t always work out.
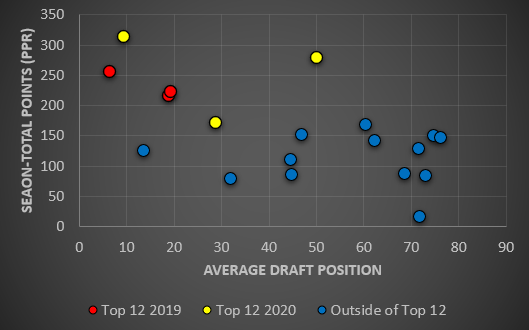
In the last two seasons, early-round TEs have accounted for just a quarter of the Top 12 across winning teams. Travis Kelce and Darren Waller were the main contributors in 2020 with a minefield of duds surrounding them. The same trend occurred in 2019 with George Kittle and Zach Ertz. The rest have been mid or late-round selections like Irv Smith Jr. (13.01 ADP, 10.3% win percentage) or Eric Ebron (12.04 ADP, 9.2% win percentage). Again, opportunity cost drives the drop-off in value towards the end of the early rounds.
Tight-ends drafted in Rounds 4-6 over the last two seasons have averaged 11.8 PPG (adjusted for 1.5PPR). In those same rounds, WRs averaging a minimum of 13.6 PPG were being drafted. Running backs capable of 12 PPG were available. Quarterbacks were also coming off the board. So, while the strategy of drafting one or even two tight-ends was successful (4.2% win percentage), it typically required one of the elite options in order to work.
Middle Rounds
| Round | QB | RB | WR | TE | PK | DF |
|---|---|---|---|---|---|---|
| 7 | 21% | 20.6% | 37.9% | 20.5% | 0% | 0% |
| 8 | 20.2% | 20.4% | 29.6% | 29.8% | 0% | 0% |
| 9 | 26.4% | 24.7% | 25.3% | 23.7% | 0% | 0% |
| 10 | 26.9% | 31.1% | 24.7% | 16.9% | 0.1% | 0.4% |
| 11 | 31% | 27.3% | 27.9% | 13.3% | 0% | 0.5% |
| 12 | 27.5% | 26.5% | 32.7% | 11.8% | 0.5% | 1.1% |
| 13 | 25.7% | 24.9% | 32.1% | 13.6% | 1.7% | 2% |
| 14 | 18.1% | 23.6% | 34% | 12.8% | 7.3% | 4.2% |
| 15 | 12.1% | 19.2% | 35.5% | 10.4% | 13.4% | 9.4% |
The middle rounds are where we start to see quarterbacks take over the draft. ADP has become even more aggressive for the 2021 season, but winning teams were drafting quarterbacks at a maximum rate of 31.0% in middle rounds. However, as 2020 highlighted, we can’t just select any quarterback to fill out our roster.
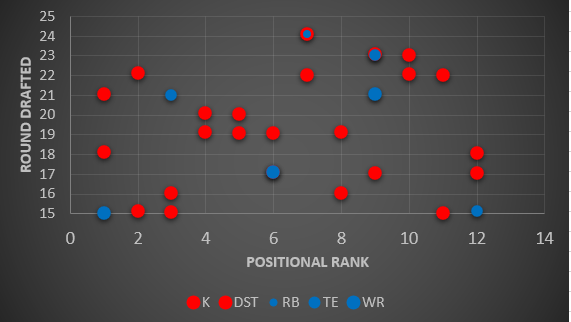
The #KonamiCode isn’t a secret anymore. It’s a requirement. In 2019, half of the quarterbacks in the top for win percentage averaged two or more points per game on the ground. That same number for quarterbacks increased to eight in 2020. For context, remember that two points are the cost of an interception. Descriptors like ‘rushing quarterback’, ‘dual-threat quarterback’, or ‘mobile quarterback’ all point to the same archetype when it comes to drafting. If a signal-caller can generate production on the ground, drafters should make them a priority for their teams.
The market has already shifted in this direction. About 16 quarterbacks were drafted on average by the 10th round in 2019. It remained somewhat consistent in 2020 with 14 quarterbacks. Early offseason drafts this year feature 21 quarterbacks. Kirk Cousins has a ninth-round ADP. While drafting more than one mobile quarterback may adversely impact your team, selecting at least one should be prioritized.
Early-round data showed a 6.7% win percentage for teams selecting a quarterback by the sixth round. Average PPG for wide receivers or running backs reach their minimum inflection point at about the seventh round. A window for drafting a quarterback while minimizing risk exists in Rounds 7 through 9. Applying a team stack or exploiting value will change this approach, but considering the other positions available during those rounds will be critical.
Late Rounds
| Round | QB | RB | WR | TE | PK | DF |
|---|---|---|---|---|---|---|
| 16 | 7.8% | 17.5% | 28.7% | 9.5% | 22% | 14.6% |
| 17 | 5.5% | 18.3% | 21.9% | 9% | 27.65% | 17.7% |
| 18 | 4.8% | 16% | 19.4% | 7.8% | 32.9% | 19% |
| 19 | 3.9% | 12.5% | 17.6% | 6.4% | 32.8% | 26.8% |
| 20 | 4% | 13.15 | 17.1% | 7.3% | 28.6% | 30% |
| 21 | 4.3% | 13.9% | 21.5% | 8.2% | 22% | 30.1% |
| 22 | 4.6% | 16.9% | 22.7% | 10% | 18.9% | 26.9% |
| 23 | 4.3% | 18.4% | 25.1% | 10.6% | 16.3% | 25.3% |
| 24 | 6.1% | 21% | 27.4% | 12.4% | 12.6% | 20.4% |
| 25 | 5.9% | 22.9% | 30.3% | 13.1% | 11.8% | 16% |
| 26 | 5.2% | 24.1% | 32% | 17.4% | 9.6% | 11.6% |
| 27 | 6.7% | 24.1% | 32.7% | 17.9% | 9% | 6.5% |
| 28 | 7.4% | 22.3% | 35.7% | 19.3% | 7.7% | 4.7% |
Kickers and defenses headline the late rounds in FFPC drafts. Additionally, fantasy managers look at this point of the draft as a time to hit on the next year’s James Robinson or Corey Davis. But even at this point, there are still tradeoffs in value to be made when selecting a player or defensive unit. We can use the different combinations of kickers and defenses as shown in the roster builds table drafted as an example.
Pittsburgh’s defense, which had the second-highest win percentage, had an ADP of 15.12. Justin Tucker, who took a step back this season but still finished as the K3, was selected as early as 15.07. But even in our rush to draft either position, there are still viable options elsewhere. In 2020, 22.2% of the Top 12 players in win percentage came during and/or after the 15th round. Justin Jefferson, Jerick McKinnon, and Jimmy Graham were all considered late-round darts that turned into high-priority options throughout the season. Not only did they provide the value we search for in picks this late, but they had a much greater impact on our teams than the defenses or kickers selected at the same point in the draft.
| Position | Late-Round Win % |
|---|---|
| WR | 13.7 |
| RB | 11.1 |
| TE | 10.8 |
The greatest win rate for either a kicker or defense was the Colts’ defense at 12.4%. Younghoe Koo and Justin Tucker were the most-common kickers drafted in two-PK builds. PIT, BAL, and IND comprised the most-common defenses selected in two-DEF builds. All were in the Top 3 as draft selections by winning teams. A somewhat-fragile strategy, taking just two at either position required a top-end result in order to be viable. The late rounds require just as much attention to opportunity cost as the earlier parts of the draft. However, given the wider selection of positions drafted, it requires a bit more nuance.
Looking Ahead to 2021
Drafters are already constructing teams even while we wait on free agency and the draft. Landing spots will alter our valuation of the player and their respective teams. Rookies will shift in ADP based on their situation. Regardless, there are some historical trends we can use to avoid drafting a suboptimal team.
Rookie value in best-ball drafts comes down to perceived talent based on college production and projected situation. We can quantify past production, but situation is subjective. It also changes as the year progresses. But it doesn’t mean to avoid incoming classes as a whole.
Miles Sanders and Jonathan Taylor are the only rookie running backs to break into the Top 12 from their respective classes. Sanders secured a 34.6% rushing share from within the 20-yard line while maintaining a 10.2% target share. Taylor handled 57.8% of the running back red zone carries on top of his 7.2% target share. Rookie running backs need a path to both scoring opportunities and involvement in the passing game before we can draft them with any certainty. Wide receivers primarily just need volume.
With receivers needing time to establish a rapport with their quarterback, rookie receivers are typically devalued. Deebo Samuel had an 18th-round ADP his freshman year. CeeDee Lamb was drafted in the 10th round this past year. But both were significant contributors to their teams right out of the gate. The minimum target share for rookie wide receivers from 2019 or 2020 that finished in the Top 12 for win percentage was 16.8%. Brandon Aiyuk (24.0% target share) and CeeDee Lamb (18.0% target share) highlighted the utility of identifying productive prospects with paths to starting in their first year. It’s tougher without draft capital or a team, but we’ll have data points on those in the coming weeks.
The Bottom Line
- Overall, a semi-balanced approach to running backs and wide receivers (leaning towards receivers) is the optimal construction in FFPC (non-slim, non-SF) best-ball drafts. Three of the top-five roster constructions have used this strategy over the last two seasons.
- Early-round constructions are more flexible, but a semi-balanced approach is still the optimal strategy. The top-three early-round constructions in 2019 and 2020 featured two or three picks at RB or WR along with one selection at TE.
- When drafting an early-round TE, five of the last six tight-ends to finish in the Top 12 for win percentage have been drafted by the end of the third round. Darren Waller is the only early-round TE to buck this trend.
- Mobile quarterbacks should be highly prioritized in drafts. Quarterbacks finishing in the Top 12 in win percentage have averaged 3.1 PPG on the ground over the last two seasons. ADP has shifted more into the middle rounds which will drive changes in opportunity cost that must be watched during your draft.
- Rookies should be considered, but only in certain parts of your draft. Rookie ball carriers required the majority of their team’s red-zone rushing attempts (minimum share of 34.6%) while being active in the passing game. Rookie pass catchers needed at least a 16.8% target share to get into the Top 12 in win percentage.
- Equal investments at DST and K (three apiece) continues to be the optimal approach. Drafting just two at either requires a top-three result in order to be viable.