The Definitive Guide to FanDuel Cash Games

The words “consistent profitably” might not have quite as sexy a ring as “Sunday Millionaire winner,” but for anyone who’s looking to come out of their DFS weekend with more money than what they put in, week-after-week, your focus better be on nailing your cash game lineup. While we won’t earn life-changing wealth in one day, being an above-average cash game player can enable greater flexibility with our bankroll over time, eventually letting us play in higher-entry contests where we can win life-changing money. And on the weeks where our tournament plays aren’t hitting, a solid backbone of weekly cash game winnings prevents a down week from becoming a complete catastrophe.
More DFS Strategy: Intro to NFL DFS | 10 Tips for New DFS Players | GPP Strategy | DFS Playbook: Positional Strategy Guides
What are cash games?
A “cash game” is an umbrella term to describe a DFS contest where roughly 50% of the contest participants win. They typically feature extremely flat (or completely flat) payout structures, meaning all winners in a contest earn the same amount of profit, regardless of the difference in their lineups' scores. Examples of cash games include head-to-head and double-up contests.
Head-to-heads, 50/50s or Double-ups?
There isn’t one definitive answer here—in fact, this topic was discussed in-depth on Episode 155 of the DFS MVP podcast, where it was suggested that newer cash game players should be gravitating towards double-up contests, particularly those where participants are limited to a single entry. This is due to the amount of DFS sharks hunting the head-to-head waters for easy prey just prior to kickoff of the main slate.
While that may be true, it’s important to quantify the expected value of these contests, and then compare them. The following chart, originally published by FantasyFootballConsultants, highlights the payout structures for head-to-heads and double-ups, as well as some other GPP-esque contests, like triple-up and 10x contests, for comparison’s sake.
| Contest | Top X% of Lineups Win | Payout | Typical Rake (as of 2020) | EV on $100 |
|---|---|---|---|---|
| Head-to-Head | 50.0% | 1.8x | 10% | -$10.00 |
| 3-Player | 33.0% | 2.7x | 10% | -$10.90 |
| 5-Player | 20.0% | 4.5x | 10% | -$10.00 |
| 50/50 | 50.0% | 1.8x | 10% | -$10.00 |
| Double-Up | 43.5% | 2.0x | 13% | -$13.00 |
| Triple-Up | 29.3% | 3.0x | 13% | -$12.10 |
| 10x Multiplier | 8.5% | 10.0x | 15% | -$15.00 |
The 50/50 and head-to-head contests have the exact same typical rake and payout structure, but double-ups force you to finish inside the top 43.5% of lineups, all for a sliver more of expected profit. The expected value on a double-up is nearly as bad as a 10x multiplier contest, where you’d need to outpace over 91% of the field. It should also be mentioned that seeking out 3-man and 5-man tournaments have a positive impact on cash game allocation, though there are certainly sharp DFS players keenly aware of this fact, and specifically seeking inexperienced players entering these contests. Dominating those contests are for another article, however.
How Much of My Weekly Bankroll Should We Be Devoting to Cash Games?
This is a highly personal decision. For some, DFS is a full-time job, and cash games are the backbone of their livelihood. Being a profitable cash game player is what sustains many pros through the variance of tournament play. For those individuals, cash games likely occupy close to 80% of their overall weekly bankroll.
On the other end of the spectrum, there are many who choose to play NFL DFS, particularly the main slate, to add a little “juice” to their Sunday afternoon experience. In this circumstance, there’s nothing wrong with treating your weekly bankroll more like “entertainment money” —money you intend to lose all of, devoting more bankroll to GPPs than would otherwise be recommended.
But everyone should be playing some cash games, and at the very least, understanding the game theory and strategy behind these contests remains vitally important. Because our goal is to simply be in the top half of lineups, we can spend a majority of our time searching for the optimal plays, which means 4for4 subscribers are at a non-insignificant advantage, equipped with some of the best projections in the industry. Remember, compared to all of the statistics I mention below, the statistic with the highest correlation to actual fantasy points scored is a player’s 4for4 projection. They are the rock-solid base of our cash-game-oriented build.
Now let’s go position by position, looking over the factors I take into account when selecting my cash game player pool.
Choosing Cash Game Quarterbacks
Quarterbacks are the highest-scoring and lowest-variance position in fantasy football. And as most season-long fantasy football players could tell you, they also have their raw fantasy points slightly devalued compared to the other positions. This is due to our ability to acquire similar projected production with a cheaper investment, and the same is true in DFS play.
The “late-round quarterback” strategy you know and love from season-long play can absolutely be adapted to cash game strategy. And while the bottom-25% of starting quarterbacks in terms of salary are usually overly risky, so too are top-tier quarterbacks, who can hurt your lineups by scoring highly, but still below their salary-based expectations. They’re a luxury pick in cash, and should really only be considered in situations where immense savings at the more valuable positions—particularly running back, wide receiver and the FLEX—allow you to do so. 4for4 subscribers can factor salary-based expectations into their roster construction strategy quite easily by utilizing the Value column in the lineup generator, as well as the Floor & Ceiling Projections tool. Sure enough, three of the top seven quarterbacks with the highest value ranking for the upcoming week have a FanDuel salary between $7,000 and $6,000, the positional minimum salary.
Regardless of the contest, for quarterbacks, we prefer projected efficiency over projected volume. This is true for quarterbacks and only quarterbacks, and it’s only true regarding their abilities as a passer. If a quarterback is a dual-threat, the more projected rushes the merrier, at least from a fantasy perspective. But it might be counterintuitive for those who have not heard it: great fantasy games (especially those achieved mostly via passing) come from quarterbacks with highly efficient performances. Since quarterbacks on winning teams generally outscore those who do not, we should also lean on favorites for our cash game quarterbacks. According to Jonathan Bales’ book Fantasy Football For Smart People, favorites outscored underdogs by nearly two fantasy points per game as of 2017. While it may be advantageous to seek slight underdogs in tournaments (since they typically go under-rostered), there’s no need to take on that risk in a cash game lineup.
Even if your opponent is clever enough to value efficiency over volume for quarterbacks, we can still outpace them by utilizing advanced efficiency metrics that tend to be more stable week to week and season to season. Instead of tracking completion percentage, which has a high correlation to fantasy success, we can utilize Completion Percentage Over Expectation to measure per-pass efficiency. “C.P.O.E,” as it’s typically referred to, takes into account the difficulty of a pass by factoring in situational aspects, as well as the distance of the throw. And instead of using traditional ratio stats like yards per attempt, we can look at Expected Points Added per Play, a measure of how a player performs compared to league-wide expectation. This metric includes rushing plays, and factors-in down, distance, situation, and even the game spread, making it one of the most robust quarterback metrics available today. The Athletic’s Ben Baldwin curates a site that tracks both metrics for free, and even allows you to filter out garbage-time play.
Choosing Cash Game Running Backs
Moving to the usage-focused positions, there’s no position whose points are more valuable to a profitable cash game lineup than your running backs. Particularly on FanDuel, where we can’t rely on receptions alone for our backs, opportunities per game (in particular, a player’s opportunities per game over the past 4-6 weeks, as mentioned in the DFS Playbook series) reigns supreme as the number one indicator of running back success. There are often a handful of players on each slate whose projected opportunities outpace the rest of their positional cohort by a wide margin, and in cash games, there is almost no reason to fade this type of volume, even if expected tournament rostership continues to skyrocket for these players. In cash games, that’s not our concern.
Your running backs should be the first place you allocate your salary in a cash game lineup, and gamers should rarely be scared off of paying up for guaranteed touches, especially guaranteed touches for home-favorite running backs, as this group has scored the highest percentage of 15, 20, 25, and 30+ FanDuel performances over the last three seasons. As of 2019, home favorites averaged nearly 0.25 more rushing touchdowns per game than underdogs.
While we might be looking at very different metrics for running backs than quarterbacks, since we’re primarily focused on volume as a proxy for expected production, we can still utilize advanced metrics to gain an additional edge on our opponents. With touchdowns being even more valuable in FanDuel’s half-PPR format, many fantasy gamers look at red zone stats to help them find value plays. But a majority of rushing touchdowns come from carries inside the 5-yard line.
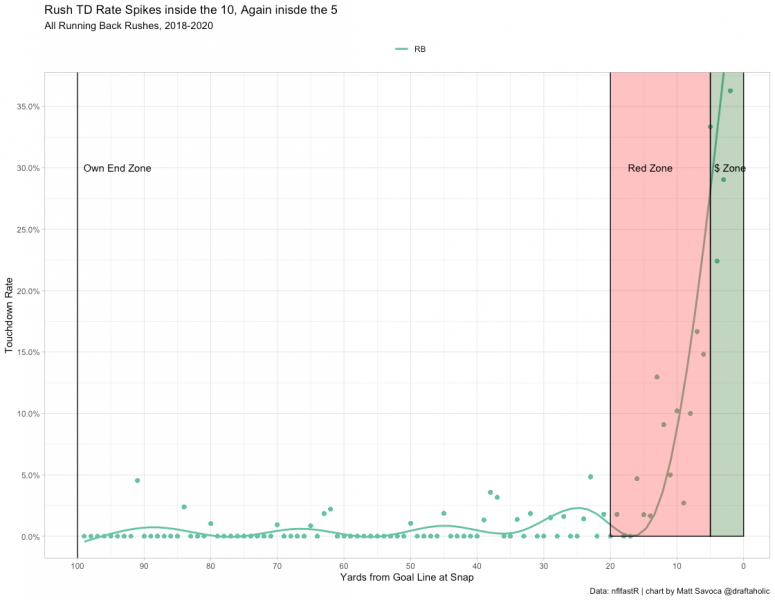
We’re easily able to see the leaders in these high-value opportunities by checking 4for4’s Red Zone Stats tool. Another valuable opportunity metric is 4for4’s expected touchdowns (xTD) metric, or even more robust, expected fantasy points, available on a variety of NFL stats services. These metrics do a much better job at factoring in the disproportionally high value of targets and goal line carries compared to all other running back opportunities. Finally, we can utilize adjusted fantasy points allowed by the opponent using the 4for4 aFPA tool to find strong matchups, but don’t over-weigh these rankings. Player predictions should only be adjusted when a back is slated to face a very bad (bottom-3) or very good (top-3) defensive unit. Running backs facing a defense with a poor aFPA against quarterbacks can also receive a slight boost.
Choosing Cash Game Wide Receivers
Unlike running backs and quarterbacks, the wide receiver position is a naturally more volatile position and carries with it significantly less scoring consistency. And yet, because FanDuel requires us to roster at least three of them, we need to make sure we have an adequate percentage of our budget allocated to this position so that we avoid the “dart throw” tier at this position at all costs. Since the positional cohort as a whole has a high variance, it’s advantageous to spend enough salary to ensure bankable production at this position.
Not dissimilar from the running backs, we’re focused heavily on volume. In fact, the DFS playbook series (though the study was using DraftKings points) found that targets were as highly correlated with fantasy points as fantasy points per game, and depending on how many weeks back you looked, it was even more highly correlated. But of course, not all targets are equally valuable. With FanDuel’s extra emphasis on touchdown scoring compared to DraftKings, we’re next seeking wideouts with consistent red zone usage when unable to roster a top-salary player. A vast majority of receiving touchdowns occur from inside the 20.
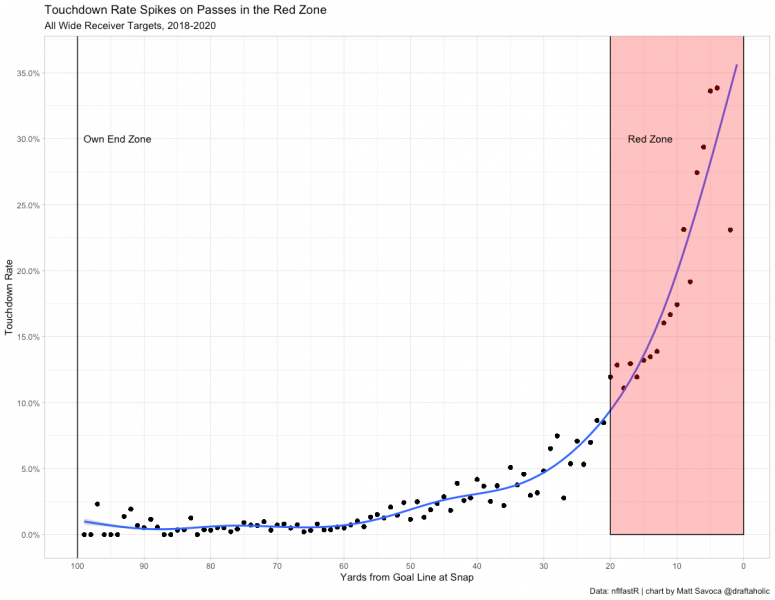
A great way to see if a player is performing above or below their red-zone expectations is to use the Expected Touchdowns metric, labeled xTD, in the 4for4 Air Yards App. Players with high expected touchdowns who have so far under- or over-performed their expectation have a high likelihood of returning to their expected touchdowns over time. Additionally, instead of looking at targets per game (which is a significantly better metric to check compared to raw targets), we can utilize Market Share of Targets, or MS Tgt in the Air Yards app, to determine pace-agnostic target rates for players. This is especially helpful when a player we’re considering is facing a fast-paced opposing offense. Yes, you read that correctly. If a receiver’s opponent’s offense plays fast and is efficient, it will inherently force a team that tends to play slower to pass more often. We account for these situations more completely when utilizing target market share instead of targets per game. With these two metrics at our disposal, we typically find low-salary receivers getting plenty of high-quality looks to round out our cash game lineups.
As a general rule, I’m aiming to play at least one receiver that is over $8,100 (13.3% of the salary cap) on FanDuel, as historically, those wide receivers have not only outperformed the rest of their positional cohort on average (which is to be expected, since they are the highest-salary players) but also met salary-based expectations more consistently. Spending extra salary on a safer bet is often an excellent idea, not just at running back when creating strong cash game builds.
Choosing Cash Game Tight Ends
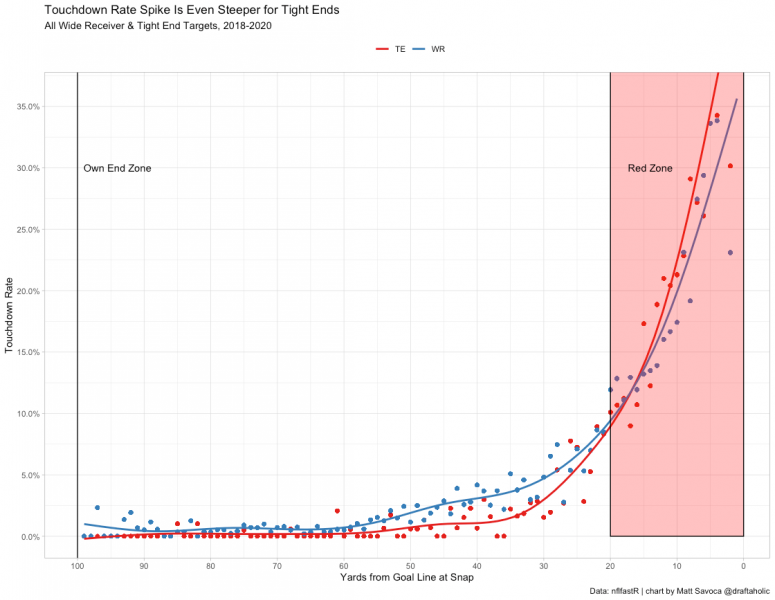
Much of what is mentioned above for wide receivers holds true for tight ends. Targets, particularly those near the goal line, are the most important factors to check when deciding on a cash game tight end. For all lineups, not just cash games, red zone usage is an even more important aspect for tight ends than wideouts.
Most importantly, however, beware of the week-to-week volatility of the tight end position in particular, due to lower overall usage compared to wide receivers. When only looking back at one week of data, the correlation of fantasy points to the next week’s fantasy points is, essentially, entirely random for tight ends. However, we see a quick stabilization of these metrics once we look back five-plus weeks, as previous research has shown. There are two primary reasons for this.
One was laid out in the DFS Playbook series on tight ends; the top-tier of the position helps stabilize the metric for the entire cohort. Additionally, and unlike wide receivers or running backs, an injury to top-tier players at the position rarely, if ever, results in a usage spike for the next tight end on the depth chart. Occasionally, a team will have a high draft-capital tight end waiting for a full-time role behind an established veteran, like the Eagles’ Dallas Goedert and Zach Ertz in 2019 and 2020, and in those situations, we can reasonably project the tight end opportunity to remain relatively stable through an injury to the starter. But this is an exception, not the rule. For most teams, when a high-usage tight end becomes unavailable, a majority of their targets are re-distributed elsewhere.
Notice that defense versus position metrics, particularly cornerback matchup metrics, have barely been mentioned in this article. That’s because these factors have already been factored into a player’s salary. The FanDuel pricing algorithm absolutely adjusts based on matchups, so there’s little need to “double-count” this feature in our selection process. To break ties though, we can start to consider matchups, especially when deciding between two low-salary options at the position. If an opposing defense has two very strong cornerbacks, or if they usually apply significant pressure to the offense they face, you can give a slight boost to tight ends playing in that game environment, as the quarterback will likely be forced into more check-down throws to running backs or tight ends. With little exception, we’re weighing aFPA very little for tight ends, unless a defense is consistently egregiously bad against the position (the 2019 Arizona Cardinals come to mind).
Choosing Cash Game Defenses
Compared to quarterbacks and the skill positions, predicting fantasy scoring for defenses is by far the most volatile week-to-week, and carries the least amount of consistently usable metric correlations to help us narrow down our options. For this reason, high-salary D/ST options aren’t usually must-plays in cash games on FanDuel, especially when you consider the FanDuel pricing algorithm typically requires you to pay a higher relative salary for these options compared to DraftKings, a trend that isn’t true for the other positions.
Still, we can gain an edge by focusing on the right metrics to break ties. First, according to FantasyFootballConsultants, the bottom-tier options at the DST position has an even greater weekly volatility than the rest of the position, which means it’s a great cohort from which to select a tournament play, but in cash games, where we’re banking on predictable performance, this is far from ideal. Instead, we want to primarily focus on teams that should be able to put opposing offenses in consistently disadvantageous positions. We’re aiming to roster defenses of winning teams, so we typically lean on favorites (heavy favorites if possible), and should strive to find defenses that can apply pressure consistently, since pressure on opposing quarterbacks leads to nearly all of the explosive defensive plays that fantasy gamers rely on: sacks, fumbles, and interceptions.
Team pressure rates are available for free on ProFootballReference. Additionally, if a team has a notoriously poor offensive line or a particularly turnover-prone quarterback, that can also boost a defense’s weekly prospects. Most importantly, don’t pay too much attention to the implied totals of the teams when selecting defenses. Yes, it’s important that your defense gives up less than 35 points in order to avoid a massive scoring penalty, but the majority of the time, it's much more important to seek projected sacks and projected opportunities for turnovers. We can almost always find a team that matches these criteria in the middle range of DST salaries.

The Bottom Line
In cash games, we’re aiming to maximize the probability that all of our players meet salary-based expectations, and almost entirely ignoring expected rostership. Though we hope the players we choose can exceed expectations, but in this format it’s significantly more damaging when a rostered player falls short of what we expected based on salary. Certain salary groups within each position have historically met their expectations more often than others (high-salary WR and RB in particular), so we almost always want to begin our lineups with these premium players. Because of this, rostering a top-three tight end or quarterback becomes a luxury we can’t always afford, only becoming available to us when an injury or personnel shift enables us to play one or more high-usage, low-salary “free-squares” in our lineups. Finally, remember that Vegas totals and defensive matchups are incorporated into player salaries without you needing to do a thing. Double-counting these factors isn’t necessary and in most situations, to do so would be a mistake.


