Week 10 DraftKings & FanDuel Winning GPP Lineup Review

In this space each week, I will review the winning lineups from the DraftKings Millionaire Maker and the FanDuel Sunday Million. Analyzing top lineups can help to tease out lineup-building strategies and offer clues on how you could have landed on a similar team.

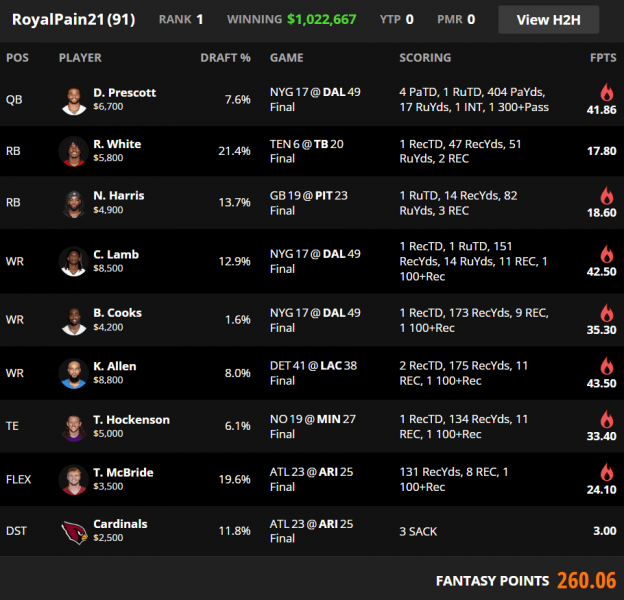
DraftKings Week 10 Millionaire Winning Lineup
Ownership
| Week | QB | RB1 | RB2 | WR1 | WR2 | WR3 | TE | Flex | Flex Pos | DEF | Cumulative |
|---|---|---|---|---|---|---|---|---|---|---|---|
| 1 | 5.8% | 15.1% | 9.7% | 23.6% | 16.9% | 5.7% | 3.7% | 2.2% | WR | 35.5% | 118.2% |
| 2 | 3.3% | 15.8% | 9.5% | 11.7% | 11.0% | 6.1% | 5.0% | 8.4% | RB | 9.8% | 80.6% |
| 3 | 3.7% | 20.4% | 16.2% | 22.8% | 20.6% | 15.7% | 9.3% | 11.0% | WR | 12.3% | 132.0% |
| 4 | 6.1% | 24.4% | 3.3% | 29.3% | 12.6% | 6.7% | 14.7% | 0.3% | WR | 6.2% | 103.6% |
| 5 | 6.2% | 44.6% | 31.2% | 20.0% | 15.8% | 4.3% | 5.6% | 31.1% | RB | 8.5% | 167.3% |
| 6 | 4.2% | 54.8% | 18.9% | 19.7% | 10.8% | 4.6% | 9.3% | 1.3% | WR | 3.4% | 127.0% |
| 7 | 11.6% | 15.5% | 10.3% | 12.4% | 4.4% | 2.3% | 19.8% | 17.9% | TE | 12.8% | 107.0% |
| 8 | 6.4% | 45.1% | 29.7% | 27.1% | 7.8% | 5.4% | 19.5% | 0.9% | WR | 8.6% | 150.5% |
| 9 | 6.9% | 17.7% | 15.7% | 34.9% | 6.8% | 3.7% | 5.7% | 10.1% | RB | 11.5% | 113.0% |
| 10 | 7.6% | 21.4% | 13.7% | 12.9% | 8.0% | 1.6% | 19.6% | 6.1% | TE | 11.8% | 102.7% |
| AVG | 6.2% | 27.5% | 15.8% | 21.4% | 11.5% | 5.6% | 11.2% | 8.9% | 12.0% | 120.2% | |
| 2022 AVG | 9.7% | 22.2% | 11.2% | 20.3% | 12.6% | 8.3% | 8.5% | 6.1% | 9.9% | 108.7% | |
| 2021 AVG | 7.6% | 19.7% | 9.5% | 17.8% | 11.8% | 7.6% | 10.0% | 4.4% | 7.1% | 95.3% | |
| 2020 AVG | 9.1% | 24.0% | 9.8% | 18.0% | 13.5% | 8.7% | 8.8% | 4.2% | 10.9% | 106.9% | |
| 2019 AVG | 7.8% | 26.7% | 14.5% | 19.7% | 10.3% | 6.6% | 12.6% | 7.9% | 11.1% | 117.4% |
Stacks
| Week | Primary Stack | Secondary Stack | Third Stack | Correlated Players |
|---|---|---|---|---|
| 1 | QB/WR/Opp RB | 3 | ||
| 2 | QB/RB/TE | RB/DEF | RB/Opp WR | 7 |
| 3 | QB/TE | RB/WR | 4 | |
| 4 | QB/WR | RB/Opp WR | WR/Opp TE | 6 |
| 5 | QB/WR | RB/DEF | RB/Opp WR | 6 |
| 6 | QB/WR/TE | RB/WR | 5 | |
| 7 | QB/TE | RB/Opp TE | 4 | |
| 8 | QB/WR/WR | 3 | ||
| 9 | QB/WR/WR/TE/Opp RB | 5 | ||
| 10 | QB/WR/WR | TE/DEF | 5 |
Flex
The winning Millionaire lineup flexed a tight end for the second time this year and the 10th time since the start of 2019. It was the third time this year that top-1% lineups flexed a tight more often than the field (27%–21%).
On a slate where running backs projected poorly, top-1% lineups flexed running backs just 11% of the time—the lowest rate of the season—compared to 22% of the field.
Leverage/Unique Builds
The Cowboys defense and Tony Pollard combined for 66% ownership. On a slate where Dallas had the highest team total, stacking their passing game provided leverage off of the low-volume narrative.
Amon-Ra St. Brown was in 30% of lineups compared to 8% for Keenan Allen in the same game.
Two-TE builds weren’t that unique this week but using T.J. Hockenson as a salary pivot off of Dalton Schultz ($4,900, 21% ownership) was.

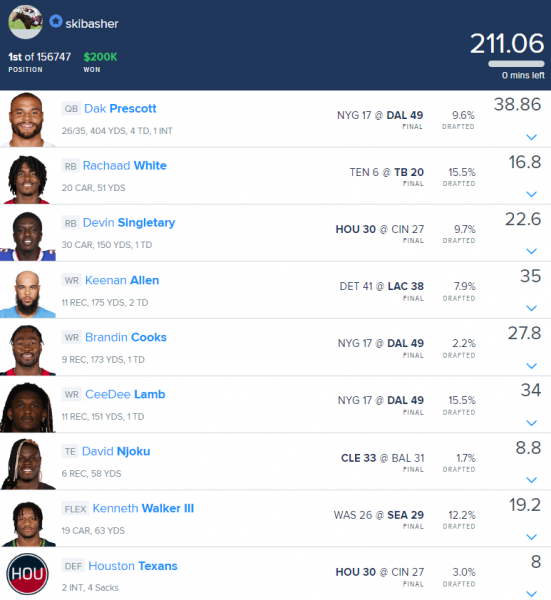
FanDuel Week 10 Sunday Million Winning Lineup
Ownership
| Week | QB | RB1 | RB2 | WR1 | WR2 | WR3 | TE | Flex | Flex Pos | DEF | Cumulative |
|---|---|---|---|---|---|---|---|---|---|---|---|
| 1 | 4.3% | 20.2% | 14.9% | 23.3% | 20.0% | 4.0% | 10.9% | 0.6% | WR | 1.2% | 99.4% |
| 2 | 2.2% | 13.1% | 10.8% | 11.3% | 10.7% | 7.1% | 6.4% | 3.3% | RB | 30.5% | 95.4% |
| 3 | 26.4% | 29.7% | 17.4% | 10.7% | 8.7% | 8.2% | 14.0% | 13.6% | RB | 4.1% | 132.8% |
| 4 | 10.0% | 27.1% | 4.2% | 10.3% | 8.0% | 1.2% | 5.4% | 2.2% | RB | 5.5% | 73.9% |
| 5 | 6.7% | 29.8% | 14.5% | 13.9% | 12.3% | 10.3% | 26.7% | 6.7% | TE | 8.7% | 129.6% |
| 6 | 11.3% | 28.8% | 20.6% | 25.6% | 11.7% | 9.4% | 2.6% | 14.7% | RB | 10.1% | 134.8% |
| 7 | 13.8% | 29.8% | 18.0% | 12.2% | 6.2% | 4.0% | 22.8% | 7.8% | RB | 4.4% | 119.0% |
| 8 | 6.3% | 18.7% | 9.4% | 17.3% | 8.6% | 7.1% | 16.0% | 4.7% | RB | 3.4% | 91.5% |
| 9 | 7.0% | 25.7% | 6.2% | 22.3% | 17.3% | 15.7% | 7.5% | 9.0% | WR | 20.6% | 131.3% |
| 10 | 9.6% | 15.5% | 12.2% | 15.5% | 7.9% | 2.2% | 1.7% | 9.7% | RB | 3.0% | 77.3% |
| AVG | 9.8% | 23.8% | 12.8% | 16.2% | 11.1% | 6.9% | 11.4% | 7.2% | 9.2% | 108.5% | |
| 2022 AVG | 10.0% | 25.9% | 14.0% | 17.7% | 11.0% | 6.6% | 8.1% | 7.2% | 7.0% | 107.4% | |
| 2021 AVG | 11.2% | 28.5% | 12.8% | 24.0% | 13.8% | 8.1% | 12.8% | 4.9% | 7.7% | 123.8% | |
| 2020 AVG | 11.1% | 25.5% | 14.0% | 22.4% | 14.0% | 9.0% | 9.1% | 8.0% | 9.4% | 122.3% | |
| 2019 AVG | 8.3% | 21.4% | 9.7% | 18.2% | 11.4% | 7.5% | 14.8% | 5.1% | 5.7% | 102.2% |
Stacks
| Week | Primary Stack | Secondary Stack | Third Stack | Fourth Stack | Correlated Players |
|---|---|---|---|---|---|
| 1 | 0 | ||||
| 2 | QB/TE | RB/DEF | 4 | ||
| 3 | QB/Opp WR | RB/Opp WR | RB/Opp WR | 6 | |
| 4 | QB/WR/TE | RB/Opp WR | 5 | ||
| 5 | QB/WR | RB/DEF | WR/Opp TE | WR/Opp TE | 8 |
| 6 | QB/RB/Opp RB/Opp WR | RB/Opp WR | 6 | ||
| 7 | QB/Opp RB/Opp WR | RB/DEF | WR/Opp TE | 7 | |
| 8 | QB/WR | RB/DEF | 4 | ||
| 9 | QB/WR/WR/TE/Opp RB | WR/DEF | 7 | ||
| 10 | QB/WR/WR | RB/DEF | 5 |
Leverage/Unique Builds
The Texans passing game was very popular, with Noah Brown at 30%, Dalton Schultz at 21%, and Noah Brown at 13%. Debin Singletary provided leverage off of the passing game while the Houston DST was a play against chalky Bengals players.
David Njoku didn’t have a huge game but the theory was sound as a salary pivot off of Trey McBride ($5,100) and Evan Engram ($5,600), the tight ends with the highest ownership projection on the slate.


