Trey Sermon is a Low-Upside Committee Back in the Making

If you’ve ever gone thrift shopping, you know that there are only two outcomes to that kind of excursion. It’s either: you find some great trinket for a cheap price, or you’ll spend hours digging through random piles of nonsense and eventually settle on a book missing its dust jacket and all of chapter 47; there’s no middle ground. The upshot of getting a thrift store puzzle, for instance, is the savings, but you have to be comfortable with a few torn corners and missing pieces.
The problem comes when that sealed puzzle box that you’re looking at also holds a higher price tag. Maybe it still has a nice exterior and comes from a company you know you like, but it was thrown haphazardly onto a shelf with a lot of other puzzles. And you have no idea which one will end up complete—if any.
EDITOR'S NOTE: Read more player profiles from the rest of the 4for4 staff!
That’s the puzzle, if you will, that we have in trying to figure out how fourth-round rookie running back Trey Sermon fits with the San Francisco 49ers heading into the 2021 season. He joins a backfield with veteran Raheem Mostert, journeyman Wayne Gallman, fellow explosive rookie Elijah Mitchell, and 2020 UDFA breakout sensation JaMycal Hasty.
Can Sermon be a rookie fantasy value in the Bay Area’s backfield, or will he break your budget (and heart)?
Sermon's Sticker Price
Sermon carries late Day 2 draft capital (third round; 88th overall) with him into the NFL, which is more solid than most of the rookie runners in this lackluster class. He was selected as the fourth running back off the board and the 49ers did trade up to select him, which signals that the team values him highly. Our own John Paulsen studied this effect in 2019, finding that third-round trade up backs outproduce others by 54.1%—a sizable increase in value.
By making it into the third round, also, Sermon secured a solid historical value range for himself. The R correlation between rookie year PPR fantasy points per game and both draft round and overall draft pick yield coefficients stronger than -0.60—an extremely significant relationship. This makes sense: the more draft value a team invests in a player, the earlier they want him to contribute. At a position like running back, where touches are schemed by the team and are less completely “earned”, therefore, higher drafted rookies see more work and create more fantasy production.
We can see this also when we break down the average fantasy production for rookie running backs by draft round. This is shown in the table below.
| Round | Games | PPR | PPR/G |
|---|---|---|---|
| 1 | 14.1 | 190.2 | 13.5 |
| 2 | 12.2 | 118.7 | 9.7 |
| 3 | 12.4 | 100.4 | 8.1 |
| 4 | 13.3 | 68.1 | 5.1 |
| 5 | 11.6 | 49.4 | 4.3 |
| 6 | 9.8 | 33.2 | 3.4 |
| 7 | 9.2 | 19.4 | 2.1 |
Running backs selected in the second or third round of the NFL Draft average significantly fewer fantasy points than first-rounders, but there is a steep drop-off to the late-round options. The 8.1 PPR points per game that third-round runners average drops off to just 5.1 for fourth-rounders. This 37% drop in PPR per game from third round to fourth round is the second-largest behind the sixth- to seventh-round drop-off.
This all sounds fairly positive for Sermon’s outlook, especially if you’re comparing him to his other rookie peers. The trouble, however, is that Sermon enters a foggy backfield situation in San Francisco.

The Bigger Picture
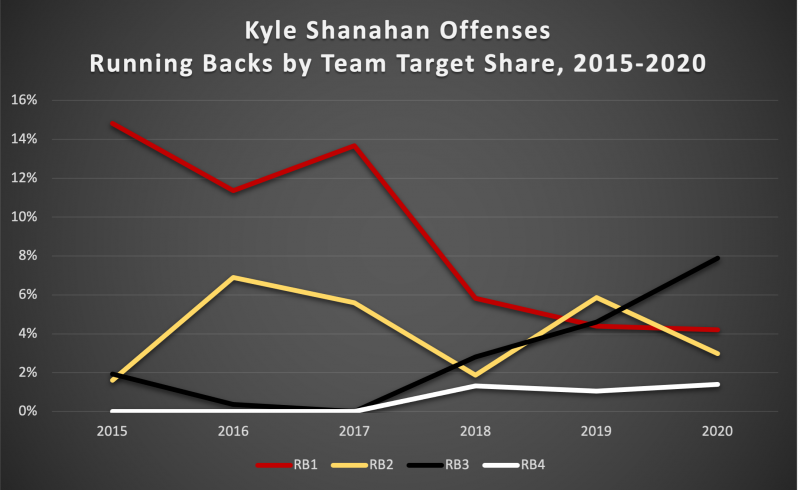
Not only will Sermon have to compete for touches with the other four backs mentioned before, but head coach Kyle Shanahan’s offensive rushing scheme also can limit individual fantasy upside. The charts below show the running back rush shares and target rates for each running back role in the Shanahan offense since 2015.
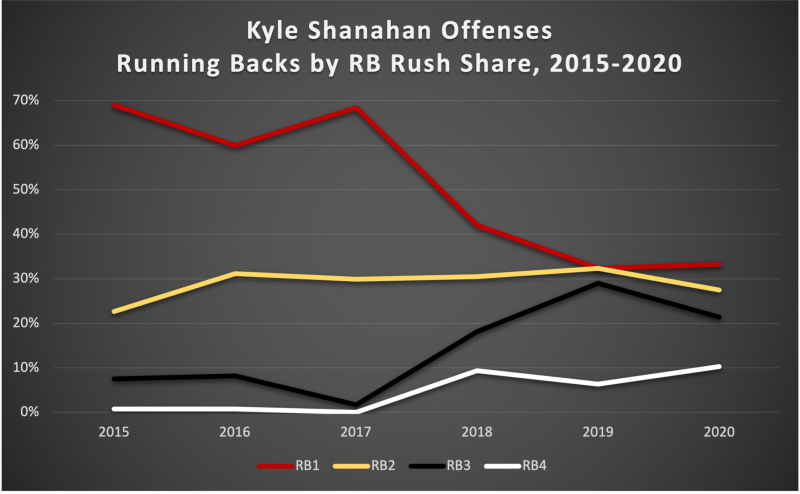
In Washington—before these chart’s scopes—Shanahan utilized Alfred Morris as a primary rushing back who toted the rock an average of more than 300 carries per season from 2012–2013.
Since that blip, however, we can see two clear phases of Shanahan’s running back usage. The first phase comes from 2015–2017, his two years with the Atlanta Falcons and his first year in San Francisco. Each of these years featured an RB1 who rushed for 60% to 70% of the team’s running back attempts and saw an 11% to 15% team target share. This left just 20% to 30% of the running back rushes and a 2% to 6% target rate for the RB2, with the RB3 and RB4 basically not utilized at all.
The second phase, coming from 2018 to last year, is a much muddier situation. Even factoring in injuries, the Shanahan RB1 role’s workload has plummeted by over half in both running back rush share and team target share over the last three years. Interestingly, the RB2 role’s workload has largely stayed the same. The RB3 has taken over significantly more work—even before the injury-stricken 2020 season—jumping from a rush share between 2% and 8% to around 20% and from a target share capped at 2% to one between 3% and 7%.
What this all boils down to is that over the last three years, the top three roles in a Kyle Shanahan backfield have all largely looked the same, with the RB3 perhaps breaking out as a pass-catching specialist. Still, there is little that separates his three-headed monster committees besides individual talent.
The Perfect Piece for San Francisco?
With no clear investment in this backfield, by either draft capital or contract obligations, it’s hard to know exactly what the pecking order will be. Is Sermon’s talent great enough to usurp the top role immediately and expand it once again?
One way we can get a rough idea of talent, especially for players who attended prestigious football schools, is to look at how they produced in comparison to the rest of their team. The table below shows Sermon’s share of his college teams’ workload. For rate stats like missed tackles forced rate (per Pro Football Focus), the number given is how much higher or lower he was than the team average.
| Year | School | Rush Attempts | Rush Yards | Yards per Rush | Yards after Contact per Rush | Missed Tackle Forced Rate | 20+ Yard Run Rate | Target Share | Rec Yards | Total Touchdown Rate |
|---|---|---|---|---|---|---|---|---|---|---|
| 2017 | Oklahoma | 30.6% | 28.9% | -0.38 | 0.16 | 9.9% | -1.7% | 4.8% | 2.7% | 6.3% |
| 2018 | Oklahoma | 46.3% | 38.2% | -1.21 | -0.61 | 3.0% | -3.6% | 3.5% | 3.9% | 15.3% |
| 2019 | Oklahoma | 18.4% | 19.2% | 0.29 | -0.64 | 1.6% | 3.1% | 2.9% | 1.7% | 5.4% |
| 2020 | Ohio State | 46.4% | 55.2% | 1.19 | 0.12 | 4.3% | 5.7% | 6.6% | 4.5% | 9.8% |
| TOTAL | 35.2% | 34.1% | -0.21 | -0.21 | 5.3% | -0.3% | 4.2% | 3.0% | 9.3% |
Sermon played in talented backfields, alongside the likes of Rodney Anderson and Rhamondre Stevenson in Oklahoma (not to mention with Jalen Hurts stealing rush attempts too) and Master Teague at Ohio State (not to mention with Justin Fields stealing rush attempts). He can only ever say he earned the most rushing attempts in his backfields, however, and never dominated touches. Even if we exclude his injured 2019 season, Sermon’s college career running back rush share just barely crosses the 40% mark.
His receiving work also leaves something to be desired, earning just 3.0% of his teams’ receiving yards over his college career on only a 4.2% target share.
In addition, the rate stats show a picture of a running back who steadily improved his yards per rush and 20-plus yard rush rate and has been consistently elusive but is lacking in power (relatively mediocre yards after contact per rush). Sermon has prototypical size for a potential three-down rusher, but he seems to run much smaller than his build would suggest.
Earlier this year, I did a study on how college workload indicates future NFL usage. In short: Sermon’s rushing usage (10.0 rushes per game) is almost exactly average for a drafted running back in the NFL, so there should be no concerns about his ability to see groundwork in the future. His 4.2% team target share, however, puts him in the bottom 25% of drafted backs. The earned nature of targets in the passing game indicates that he likely has a capped receiving ceiling in the pros.
Takeaways
- Third-round running backs provide on average 100.0 PPR fantasy points in their rookie seasons. The 49ers trading up for Sermon indicates additional confidence in his value to the team (and therefore his likely eventual usage).
- Over the last three seasons, the top three running backs by snap count in Shanahan offenses have little to no difference in the volume of rushes or targets or the makeup of their usage. This caps each individual’s fantasy potential.
- Sermon’s college production indicates an elusive running style lacking in power, reminiscent of former Shanahan running back Tevin Coleman. He has the highest draft capital investment among running backs on the team but could start his career as the agility-based RB2 complement to Raheem Mostert.
- Sermon earned very little receiving work in college, partly because he was paired with rushing quarterbacks. With Trey Lance the future of the team under center, though, that’s not likely to change.
- Sermon is currently being drafted as the RB28 by Underdog Fantasy ADP, as an early seventh-round selection and the top San Francisco back off the board. This is a hefty price tag for him, considering historical numbers for the RB2 for Shanahan has produced 6.2 PPR points per game. That equates to 104.6 PPR points in a 17-game season, but the per-game rate would’ve made Sermon the RB50 last year—exactly the range that our models project Sermon for.
- The limited receiving upside and current price tag suggest Sermon is a player to avoid for 2021, and instead to select Raheem Mostert, going as the RB29 in the later seventh, who we project as a top-30 back. This could change with training camp reports, but the value isn’t there for Sermon at this time.