A Look Back at Quarterbacks in 2019

There really isn’t an offseason.
At least, that’s what I’ve come to believe. Look at social media over the final month of the season. If we weren’t discussing the current NFL storylines, free-agency speculation was already underway. Players were taking their opening stances on upcoming contract negotiations. The incoming rookie class was already generating some buzz. The Super Bowl hadn’t even been played and yet the stage was already set for a multitude of developments that will be followed by everyone from now until the first kickoff of the 2020 season. But, let’s take try and take a step back.
Quarterbacks, and their various styles and level of production, were a consistent topic of discussion throughout the 2019 season. From Daniel Jones to Ryan Fitzpatrick to Lamar Jackson, fantasy gamers had multiple paths to follow at the QB position to secure them a championship. Since I wrote the weekly 'Streaming Quarterbacks' column, I wanted to look back on the position and find any trends we can take with us as we look forward to next season.
QB1-12 vs ADP
I continually harp on process. Finding useful metrics or traits. Checking trends and their repeatability. Pulling it all together and constantly adjusting based on new information. Process over results.
The late-round draft strategy is one I’ve researched from different angles. Whether it’s looking at weekly upside or weighing opportunity cost, avoiding early-round investments has typically paid off. This past season was no different.
| 2019 | 2018 | 2017 | |
|---|---|---|---|
| QB1 | 116.01 | 122.59 | 57.39 |
| QB2 | 119.25 | 110.57 | 157.46 |
| QB3 | 83.76 | 105.73 | 74.91 |
| QB4 | 39.78 | 40.83 | 25.88 |
| QB5 | 107.74 | 24.96 | 82.25 |
| QB6 | 149.69 | 86.27 | 223.5 |
| QB7 | 17.12 | 69.71 | 154.1 |
| QB8 | 78.2 | 48.44 | 91.65 |
| QB9 | 117.88 | 115.14 | 105.25 |
| QB10 | 50.98 | 87.18 | 90.92 |
| QB11 | 67.13 | 62.53 | 37.79 |
| QB12 | 115.42 | 103.28 | 162.19 |
Now to be fair, late-round drafters have been somewhat spoiled. Having Patrick Mahomes finish as the QB1 in 2018 only to have Lamar Jackson follow him up the next season feels like an outlier. That’s two MVPs both of who had ninth-round or later ADPs in their breakout seasons. However, they weren’t the only ones.
This past season featured six different quarterbacks who could be found in the later rounds of most drafts. It's the most we’ve seen over the past three seasons. Injuries to stars like Drew Brees, the reemergence of Ryan Tannehill, and a changing of the guard in Daniel Jones only reinforced the value in waiting at the position. While neither Tannehill nor Jones saw enough sustained success to make the Top 12, their 12 total Top-12 weeks (3 finishes as the QB1) reshaped the fantasy landscape. With so many memorable performances by guys we could find on the waiver wire, I decided to dig into it more.
Streamers
We fall in love with our rosters shortly after the draft. The players who fell to us, any sleepers we could get, or favorite players we get to start each week. But then the season starts. If you drafted Baker Mayfield early or even Philip Rivers late, streaming became the optimal choice. Based on the relative performances of streamers, it likely defined your season.
I looked at 12-team leagues and found the rate of Top-12 weeks and finishing as the overall QB1. My first pass looked at quarterbacks drafted outside of the Top 12. However, most leagues don’t draft this way. Some fantasy managers draft two quarterbacks already planning to play the matchups prior to the start of the season. I increased the threshold to the Top 16 quarterbacks selected to set the pool of streamers.
| Year | Top 12 Hit Rate | THE QB1 Hit Rate |
|---|---|---|
| 2019 | 40.6% | 31.3% |
| 2018 | 34.4% | 18.8% |
| 2017 | 49.5% | 43.8% |
Likely drafted quarterbacks dominated the scores, but streaming options provided more than just a floor in 2019. With multiple QB1 and Top-12 weeks, streamers likely contributed to teams throughout the season. Jacoby Brissett had four Top-12 weeks in the first half of the season. Ryan Tannehill quickly took over after Week 7 with eight Top-12 weeks after he took over in Week 7. Ryan Fitzpatrick had three Top-12 weeks during the playoffs. Streaming provided both depths at the position, along with a significant spike in upside. With more changes at the position expected during the offseason, we’ll be looking at a similar pool of options headed into the 2020 season.
Takeaways
I’m all about process. The QB streaming articles from this past season highlighted trends, metrics, and general observations that would help identify quarterbacks with a chance to produce week in and week out. A lot of what we saw in 2019 caused me to question some of these trends and see if they’re connected. And it all started here.
this is so important bc teams take on the personality of their QB (and HC)
— Sigmund Bloom (@SigmundBloom) October 24, 2019
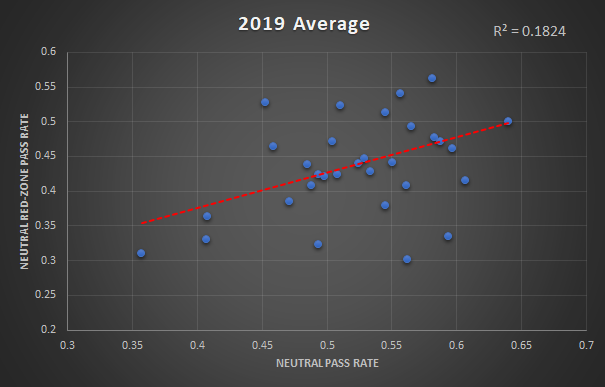
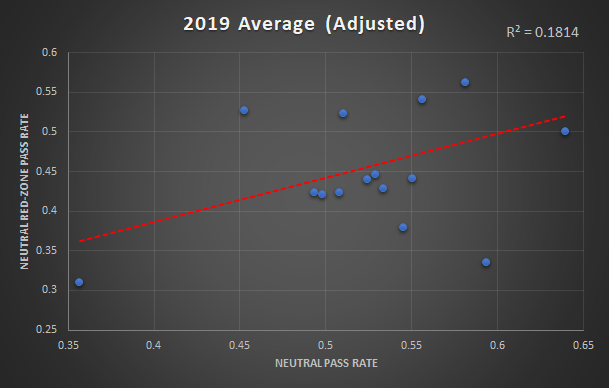
This idea. This narrative feels right. It’s typically realized in what we call ‘momentum’ and the swings can be both good and bad. But we care about production and fantasy scores. So, I’ve attempted to measure if there’s a connection between a team’s identity and their behavior when it matters most: in the red zone. Using data from Sports Info Solutions, we can isolate how teams act independently of game script. If what teams do in neutral situations (e.g. when the point differential is ±7 points) correlates to their plans inside their opponent’s 20-yard line, the likelihood of identifying useful fantasy performances should increase. Or, at least, that’s the idea.
I started with calculating pass rate in neutral situations between each 20-yard line to get a sense of a team’s identity. Without scoring opportunities or leads to protect/overcome, a fair sense of what the quarterback and head coach/coordinator typically want to do can be surmised. Next, I filtered for red-zone passing rate in neutral situations. Again, the objective was to isolate a data set agnostic of game script. Looking at the correlation between the two in-game scenarios helps quantify any connection between the two.
Not insignificant, but this lacks context and a true connection to the intent of the analysis. Quarterback/coordinator connections require time to establish themselves. A young quarterback (e.g. Jacoby Brissett) may want to follow the play as designed. An established veteran (e.g. Aaron Rodgers) may take matters into their own hands. To adjust, teams with a coaching or quarterback change were removed from the data set. Examples include:
- Cincinnati Bengals – Hired new head coach and offensive coordinator
- Denver Broncos – New starting quarterback, head coach, and offensive coordinator
- Cleveland Browns – New head coach and offensive coordinator
- Arizona Cardinals – New starting quarterback, head coach, and offensive coordinator
All that remains are established relationships between quarterback and coordinator. Essentially, a better comparison. A significant drop was expected once the adjustment was made. That didn’t happen.
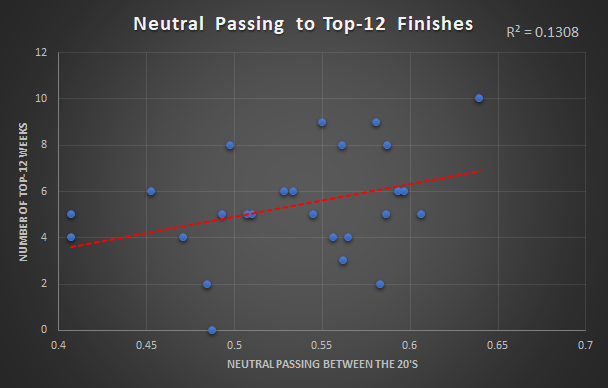
A minimal drop-off in correlation keeps both findings within the realm of statistical significance as related to NFL analysis. But we’re ignoring two key factors when abstracting actionable evidence from the results: sample size and points scored. A single year doesn’t account for changes between seasons that would alter a team’s identity. In addition, for quarterbacks, we care about touchdowns and converting those red zone attempts into points. We can address the former concern first.
The data set was expanded to the past three seasons. Each was analyzed from within for repeatability and each set adjusted if a significant quarterback or play-calling role occurred. The results were encouraging.
| Year | All Teams | Adjusted |
|---|---|---|
| 2019 | 0.1824 | 0.1814 |
| 2018 | 0.2484 | 0.2550 |
| 2017 | 0.4204 | 0.3583 |
The year-over-year variation highlights the volatility in looking at a single season. However, the values reinforce the idea a connection exists. The final test was looking at connections over all three seasons. However, after adjusting, only three teams (New England, Philadelphia, and New Orleans) had no significant changes between 2017 and 2019, limiting the analysis. The other issue is red-zone efficiency. We need points. We need production. However, red zone efficiency varies from year to year. The coefficient of variation, or the relative standard deviation, for the three-year period was 13.4%. It highlights the volatility of scoring touchdowns, but lessens our expectations. Fear not, there’s hope.
After adjusting for rushing quarterbacks and teams that use their quarterback in the red zone, we can see a connection between neutral pass rate and what we want as fantasy managers - points. It’s not meant to completely change our thinking. However, it’s enough for me to continue using neutral pass rate as a part of my streaming process going into the 2020 season.
Data Sources: MyFantasyLeague (ADP), SportsInfoSolutions (Pass Rate)