Week 13 Monday Night Football Single-Game NFL DFS: Top FanDuel & DraftKings Plays

Welcome to the Showdown breakdown for Week 13 Monday Night Football, an intriguing AFC matchup featuring two teams headed in very different directions. The Bengals, grappling with injuries and immense offensive challenges are sitting at 5-6, last in the AFC North and two games behind the final playoff spot in the AFC. The Jaguars sit at 8-3, lead the AFC South, and are vying for a tie for the best record in the AFC. Let’s dig into this matchup from a DFS perspective and uncover some key plays, value options, and important strategies for this single-game slate.

For up-to-the-minute updates leading up to kickoff, be sure to join the 4for4 DFS subscriber-only Discord channel.
Game Environment
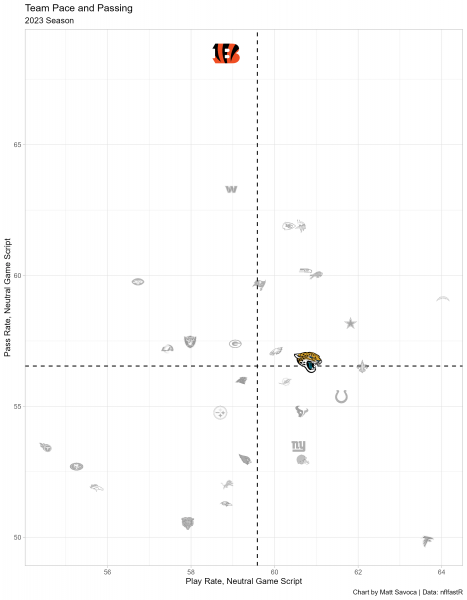
This chart represents the general offensive strategies for each team when the game outcome is still in question (win probability between 20% and 80%). The final two minutes of each half are also excluded. We’ll include last year’s statistics through Week 4 of the regular season. Teams in the upper-right quadrant pass more often and play faster than the average NFL team in neutral game scripts, and conversely, teams in the lower-left quadrant play slower and run more often than the average NFL team.
Bengals (+8.5, 15) @ Jaguars (-8.5, 23.5); Over/Under 38.5
The Jaguars, with a 23.5-point implied total, step into this game as heavy favorites. Their gameplay in neutral situations still hovers around the league average in pass rate but with a slightly faster pace, though both could downshift if they jump out to an early lead. Ranking just 18th in pass plays per game, the Jaguars’ typical offensive strategy is at least somewhat influenced by their +2.5 average score differential, the fifth-best in the NFL. Their conservative approach in high-leverage passing situations is evident from their 3.7 deep pass attempts per game, placing them outside the top-15, and 3.2 red zone pass attempts per game, outside the top 20. It’s worth noting that, at least last week against the Texans, all bets were off from a balance standpoint, and we saw the Jaguars as aggressive and pass-heavy as we’ve ever seen them, leading to one of Lawrence’s most productive days as a pro.
The Bengals, with a 15-point implied total, have seen this spread move from 8.5 to 10 in some spots heading into Monday night. Their offensive rhythm in the absence of Joe Burrow—underscored by a mere 26 pass attempts in Week 12—is non-existent. Their minimal deep and red zone passing attempts, coupled with a slow, methodical pace (27th overall this season), reflect the immense impact of Burrow. They simply cannot play uptempo with their current personnel. The Bengals’ average score differential, in the bottom third of the NFL, is likely to be further worsened as they continue this season without their starting quarterback.
Quarterback Analysis
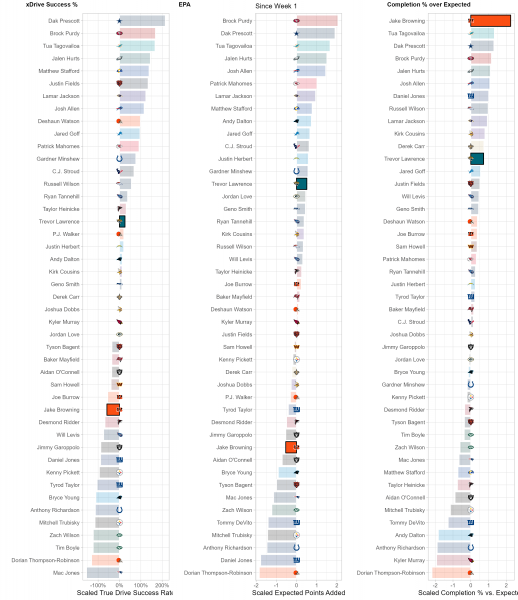
While there may be 22 people on the field for every play, each play and game is heavily dictated by the performance of each team’s quarterback. While efficiency isn’t everything for quarterbacks, it is the best indicator of future performance, so we use a trio of metrics to suss out top performers at the position compared to lackluster ones. xDrive Success %, or True Drive Success Rate, is a measurement of a QB’s ability to turn drives into scores weighted by sample size. EPA or Expected Points Added, is a measurement of the QB’s contribution, both running and throwing, to the team’s scoring and production vs. the average NFL team. Completion % over Expected (CPOE)represents the accuracy and efficiency of a QB’s passes compared to league expectations.
Jake Browning presented a mostly negative array of metrics after one full start. Despite averaging a respectable 8.7 yards per attempt in Week 12, a significant portion of his yardage (including his passing touchdown) emerged from plays that were charted as interceptable but fortuitously landed in the hands of his teammates. Browning’s Expected Points Added (EPA) per game and true drive success rate, the latter metric capable of adjusting for Bronwining’s small sample size, are well, well below league average. His completion percentage vs. expectation (which does not take into account sample size) surprisingly tops the NFL, further suggesting a significant role of randomness (read: luck) in his current per-pass efficiency. That metric is guaranteed to decrease in the weeks to come.
Trevor Lawrence, coming off a stellar performance in Week 12 with 364 passing yards at 9.6 yards per attempt, has shown strong evidence he’s finally hitting stride as a passer this season. Week 12 marked his second consecutive top-six fantasy finish, the first time he’s accomplished that this season. While not making the monumental leap many expected in 2023, Lawrence’s play has been more than adequate, as he ranks above average in completion percentage vs. expected, true drive success rate, and EPA per game. Lawrence still ranks outside the top 10 in QBR and adjusted yards per attempt, and expected fantasy points per game, but ranks no lower than 16th in any of those categories. His added fantasy value comes from 4.6 rushes per game, the 12th most among NFL quarterbacks. However, these stats place him just 17th in fantasy points per game among quarterbacks, we’d like to see Lawrence ascend the ranks in the weeks to come.
Core Plays and Auxiliary Options

- DFS & Season-Long Content
- Lineup Generator
- Optimal Cash & GPP Lineups
- Floor & Ceiling Projections
- -Leverage Scores
- -...and much much more!


