Week 11 DraftKings & FanDuel Winning GPP Lineup Review

In this space each week, I will review the winning lineups from the DraftKings Millionaire Maker and the FanDuel Sunday Million. Analyzing top lineups can help to tease out lineup-building strategies and offer clues on how you could have landed on a similar team.
DraftKings Week 11 Millionaire Winning Lineup
Ownership
| Week | QB | RB1 | RB2 | WR1 | WR2 | WR3 | TE | Flex | Flex Pos | DEF | Cumulative |
|---|---|---|---|---|---|---|---|---|---|---|---|
| 1 | 9.1% | 14.2% | 9.3% | 27.1% | 12.5% | 11.2% | 17.2% | 7.9% | WR | 3.0% | 111.5% |
| 2 | 3.6% | 10.4% | 8.4% | 21.3% | 19.7% | 14.4% | 9.2% | 6.3% | WR | 1.8% | 95.1% |
| 3 | 2.3% | 16.0% | 13.9% | 16.9% | 8.8% | 5.6% | 2.6% | 1.4% | WR | 15.7% | 83.2% |
| 4 | 6.8% | 38.0% | 15.2% | 15.4% | 11.4% | 5.7% | 19.8% | 6.1% | RB | 3.3% | 121.7% |
| 5 | 12.1% | 14.1% | 13.9% | 27.0% | 13.4% | 7.5% | 7.8% | 9.6% | RB | 22.7% | 128.1% |
| 6 | 4.4% | 12.7% | 8.5% | 14.7% | 4.9% | 3.2% | 2.6% | 2.4% | WR | 0.6% | 54.0% |
| 7 | 17.0% | 46.7% | 32.1% | 15.4% | 2.6% | 2.1% | 8.1% | 21.4% | RB | 43.8% | 189.2% |
| 8 | 21.1% | 50.9% | 12.5% | 27.6% | 28.8% | 26.4% | 1.6% | 7.4% | WR | 0.9% | 177.2% |
| 9 | 14.2% | 40.5% | 13.6% | 14.9% | 10.0% | 8.5% | 1.4% | 12.2% | RB | 10.2% | 125.5% |
| 10 | 29.4% | 25.8% | 10.6% | 20.4% | 16.9% | 10.3% | 16.0% | 2.4% | WR | 16.0% | 147.8% |
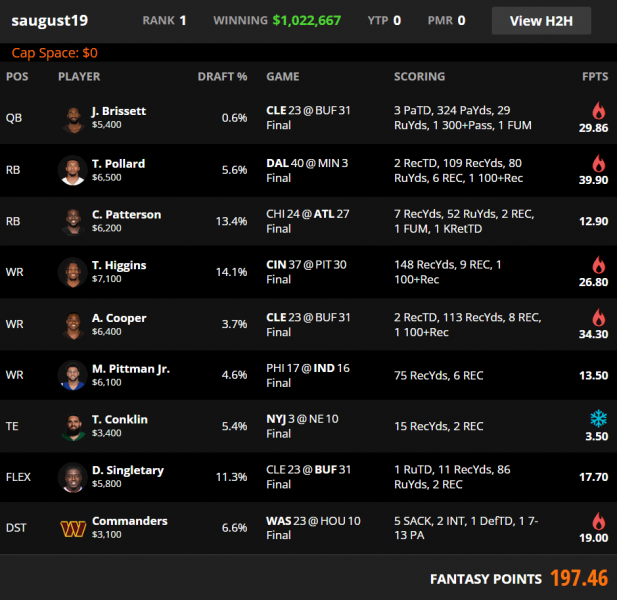
| 11 | 0.6% | 13.4% | 11.3% | 14.1% | 4.6% | 3.7% | 5.4% | 5.6% | RB | 6.6% | 65.3% |
| AVG | 11.0% | 25.7% | 13.6% | 19.5% | 12.1% | 9.0% | 8.3% | 7.5% | 11.3% | 118.1% |
The Week 11 winning Millionaire lineup had six sub-10% roster spots. It was just the second winner this year with more than five sub-10% players. Since the beginning of 2019, winning Millionaire lineups average 4.5 sub-10% players.
This lineup had 65.3% cumulative ownership, the second-lowest for a winner this season, and the third-lowest for a winner since the beginning of 2019.
Only one other Millionaire winner over the last three-plus years has used a sub-1% quarterback.
Stacks
| Week | Primary Stack | Secondary Stack | Third Stack | Correlated Players |
|---|---|---|---|---|
| 1 | QB/TE | RB/Opp WR | WR/Opp WR | 6 |
| 2 | QB/WR/WR/Opp TE | 4 | ||
| 3 | QB/TE | RB/Opp WR | 4 | |
| 4 | QB/WR/WR/Opp RB/Opp WR/Opp TE | 6 | ||
| 5 | QB/WR | RB/WR/TE | WR/Opp WR | 7 |
| 6 | QB/WR/Opp RB | 3 | ||
| 7 | QB/WR/TE | RB/Opp RB | 5 | |
| 8 | QB/WR/WR | RB/DEF | WR/TE | 7 |
| 9 | QB/WR/TE/Opp WR | RB/DEF | 6 | |
| 10 | QB/Opp WR | RB/Opp WR | TE/Opp WR | 6 |
| 11 | QB/WR/Opp RB | 3 |
Using a QB/WR/Opp RB stack and no other correlation, this is the second Millionaire winner this year to use fewer than four correlated players.
Of the 11 Millionaire winners in 2022, 10 have correlated at least one running back in some fashion.
Flex
The field flexed a tight end in 29% of lineups. Top-1% finishers flexed tight end 19% of the time. For the season, the field has flexed tight end 19% of the time compared to 15% of top-1% lineups.
Always flex the player with the latest start time possible in order to maximize late swap options. This lineup got away with ignoring this heuristic but it could be a huge leak in your game.
Leverage
Buffalo’s passing game projected for the highest cumulative ownership on the slate. Playing the opposing passing game with a Bills running back proved to be one of the best leverage plays of the week.
Dallas had the second-highest cumulative passing game ownership projection on the slate and CeeDee Lamb was the most rostered player, making Tony Pollard one of the best contrarian plays while the field avoided him with Ezekiel Elliott returning to action.
Michael Pittman Jr.’s teammate, Parris Campbell, carried the third-highest rostered rate of any wide receiver on the slate, making Pittman Jr. a valuable player despite his pedestrian fantasy output.

FanDuel Week 11 Sunday Million Winning Lineup
Ownership
| Week | QB | RB1 | RB2 | WR1 | WR2 | WR3 | TE | Flex | Flex Pos | DEF | Cumulative |
|---|---|---|---|---|---|---|---|---|---|---|---|
| 1 | 9.9% | 17.7% | 9.1% | 17.4% | 12.6% | 6.2% | 14.5% | 1.2% | RB | 2.8% | 91.4% |
| 2 | 3.0% | 7.9% | 2.8% | 9.9% | 6.4% | 5.9% | 8.7% | 0.5% | WR | 4.6% | 49.7% |
| 3 | 4.4% | 15.0% | 5.0% | 15.6% | 5.6% | 4.2% | 4.1% | 1.9% | RB | 6.6% | 62.4% |
| 4 | 2.2% | 31.2% | 12.8% | 11.7% | 7.6% | 7.6% | 20.1% | 3.9% | RB | 4.8% | 101.9% |
| 5 | 17.8% | 17.4% | 13.0% | 22.7% | 14.7% | 0.9% | 3.8% | 6.3% | RB | 4.6% | 101.2% |
| 6 | 4.2% | 29.8% | 2.9% | 13.7% | 4.3% | 4.0% | 0.4% | 0.7% | WR | 8.0% | 68.0% |
| 7 | 16.2% | 25.1% | 22.6% | 17.5% | 5.4% | 4.0% | 11.3% | 16.0% | RB | 2.9% | 121.0% |
| 8 | 22.7% | 61.6% | 14.9% | 25.7% | 23.0% | 10.3% | 7.7% | 14.3% | RB | 17.0% | 197.2% |
| 9 | 7.2% | 31.1% | 8.8% | 16.0% | 12.1% | 4.3% | 1.1% | 6.4% | RB | 11.6% | 98.6% |
| 10 | 21.6% | 26.0% | 10.5% | 24.4% | 17.1% | 6.3% | 13.7% | 5.2% | RB | 12.4% | 137.2% |
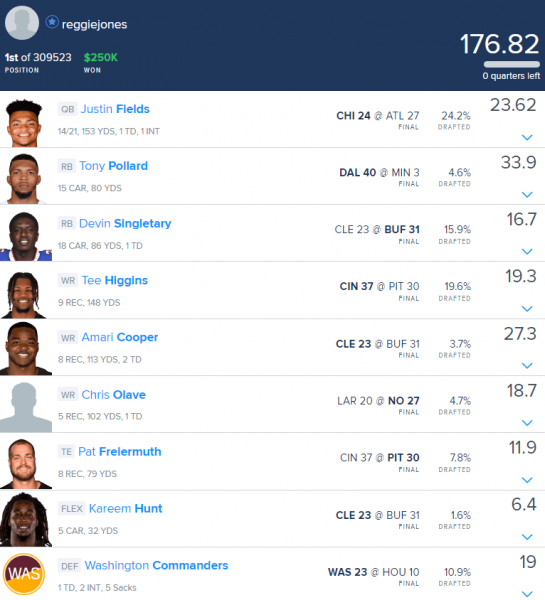
| 11 | 24.2% | 15.9% | 4.6% | 19.6% | 4.7% | 3.7% | 7.8% | 1.6% | RB | 10.9% | 93.0% |
| AVG | 12.1% | 25.3% | 9.7% | 17.7% | 10.3% | 5.2% | 8.5% | 5.3% | 7.8% | 102.0% |
Week 11 marked the second time since the beginning of 2019 that the Sunday Million winner rostered a quarterback with a rostered rate of at least 20%.
The average cumulative ownership of 2022 Sunday Million winners is 102%. From 2019–2021, that number was 118%.
Stacks
| Week | Primary Stack | Secondary Stack | Third Stack | Correlated Players |
|---|---|---|---|---|
| 1 | QB/TE | 2 | ||
| 2 | QB/WR/WR/Opp TE | RB/Opp WR | 6 | |
| 3 | QB/TE | RB/WR/DEF | RB/WR | 7 |
| 4 | QB/RB/WR/TE/Opp WR | RB/WR | 7 | |
| 5 | QB/WR/WR | RB/TE | 5 | |
| 6 | QB/WR | WR/TE | 4 | |
| 7 | QB/WR/WR | 3 | ||
| 8 | RB/WR | WR/Opp WR/Opp TE | 5 | |
| 9 | QB/WR/TE | RB/WR | 5 | |
| 10 | QB/TE | RB/WR | 4 | |
| 11 | RB/WR/Opp RB | WR/Opp TE | 5 |
For the second time this year, the Sunday Million winner played a quarterback without one of his pass-catchers. This happened three times over the previous two seasons.
An RB/WR mini-stack has been used by the last four Sunday Million winners and eight times in the 11 winning lineups this season.
All but one winning Sunday Million lineup this season has correlated their tight end with another player in the same game.
Flex
Week 11’s winner rostered three running backs, the ninth time that the top lineup flexed running back.
Since Tony Pollard had a 4:25 kickoff, he should have been the player in the flex.
Leverage
Buffalo projected as the fourth-most popular offense on the slate while just one offense had a lower cumulative ownership projection than Cleveland—pairing Amari Cooper and Kareem Hunt together helped this lineup separate from the field and was propped up by Devin Singletary on the other side.
Alvin Kamara had a 25% ownership ceiling which made Chris Olave a great stand-alone contrarian play.


