TJ's #Taek: Week 10 NFL DFS Recap

Week 10’s winning lineups from the biggest contests on FanDuel and DraftKings can be used to tease out lineup-building strategies and offer clues on how you could have landed on a similar team. Reviewing your hits and misses each week is imperative if you want to be a profitable DFS player but examining winning lineups is also a useful exercise in cultivating a winning approach.
DraftKings Week 10 Millionaire Winning Lineup
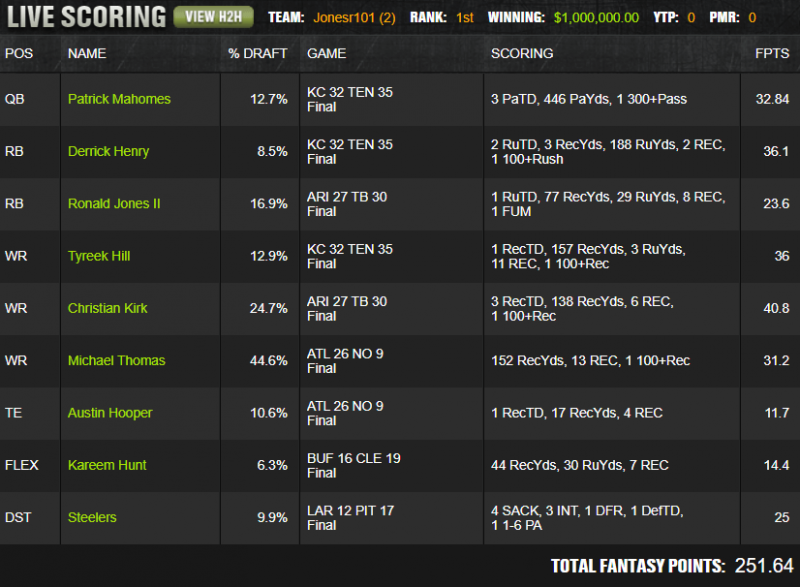
In Week 10, DraftKings deviated from their traditional $20 buy-in Millionaire contest, opting for a $100 buy-in that was capped at 43,499 entries. For those with smaller bankrolls, DK rolled out a $10 Mini Special with 235,295 entries. Comparing these two contests helps illustrate how the difference in the size of the field and the quality of the competition (we can assume that the players at higher stakes are better on the whole) impacts the results. Both contents had a cash line of roughly 158 points but it took a score of 260.92 to take down the Mini Special, while 251.64 points were enough to top the field in the Millionaire. We will examine the latter.
It was another week where the chalk came through in a big way, as Jonesr101 rostered just two skill players who showed up in fewer than 10% of lineups. When making a lineup full of popular players, you still need to find a way to be unique—this lineup chose the untraditional QB/WR/Opposing RB stack. When making game stacks, owners often look to roster opposing passing games, but doing so blindly can leave money on the table, especially in a game such as the Titans-Chiefs, where both offenses have wildly different philosophies. While a passing game and the opposite running game shouldn’t necessarily be a weekly staple in your arsenal, a quarterback and the opposing running back do have a slightly positive correlation. We have seen some contrarian running back plays work this season in GPPs more than in previous years but this marked just the third time in 2019 that a winning Millionaire lineup didn’t pay $8,000 for at least one running back. Speaking of running backs, a running back has been used in the flex spot in the winning lineup six times, compared to four wide receivers.
What Were the Indicators for the Low-Owned Plays?
Once Patrick Mahomes was activated for Week 10, we knew this game could have some fireworks. While Titans pass-catchers gained some steam heading into Sunday, betting on a game script that benefited Tennessee proved to be the winning play. Going into the week, the Titans ranked 11th in rushing rate in neutral game script and Kansas City’s defense ranked 31st in schedule-adjusted fantasy points allowed to running back.
Sometimes coachspeak is real and Freddie Kitchens was adamant Kareem Hunt would have a role in the offense. While Nick Chubb played 81% of the snaps, Hunt still managed to be in on 54% of the plays, due to his work in the passing game. Hunt saw nine targets to Chubb’s four and that was enough to pay off is min-salary price tag. While Hunt was obviously not a popular option, anyone using the 4for4 Lineup Generator heading into the week should have noticed lineups overwhelmingly favored paying up for pass-catchers over running backs.
FanDuel Week 10 Sunday Million Winning Lineup
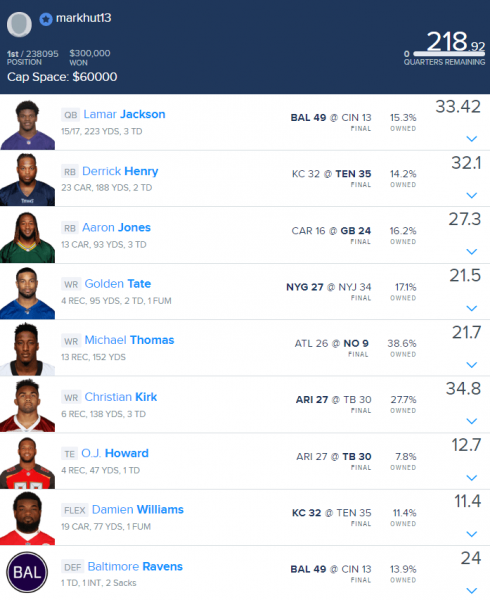
The winning lineup on FanDuel didn’t even need a contrarian play to take down the field—ownership near 8% is relatively high for a tight end—but that doesn’t mean the lineup wasn’t unique. One way to differentiate yourself from the field is to roster a “naked” quarterback—a signal-caller who isn’t stacked with one of his pass-catchers. This usually works best with mobile quarterbacks in passing games that aren’t uber-concentrated. It’s obvious Lamar Jackson can corner all of the points for his offense but the average fantasy player may have still looked to stack him with Either Mark Andrews or Marquise Brown. Coming out of their Week 8 bye, though, the only player who saw more than 20% of the targets in Week 9 was Nick Boyle, so there was some indication a “naked” Lamar was viable here.
TJ’s Final #Taek
In this space last week, I mentioned how important it is to make sure we use relevant data in our weekly research, especially with season-long numbers since that landscape of football shifts so dramatically from Week 1. For fantasy purposes, one of the most important things we can know about an offense is whether they want to run or pass. One of the best indicators of a team’s intentions is how they act in neutral game script, or when the game is within a single score. The following data shows neutral passing rates for every team over the first five weeks of the season and how the data looks over the last five weeks. Keep these numbers in mind when you inevitably hear any mention of season-long rates moving forward.
| TEAM | Neutral Pass %, Weeks 1–5 | Neutral Pass %, Weeks 6–10 | Difference |
|---|---|---|---|
| TB | 49.1% | 62.1% | +13.0% |
| DET | 53.6% | 62.7% | +9.1% |
| IND | 45.6% | 54.4% | +8.7% |
| SF | 45.3% | 53.2% | +7.8% |
| SEA | 46.5% | 53.3% | +6.8% |
| NYG | 58.3% | 64.5% | +6.2% |
| NO | 58.3% | 61.6% | +3.3% |
| OAK | 50.4% | 52.8% | +2.4% |
| MIA | 57.0% | 58.8% | +1.8% |
| NE | 62.7% | 64.2% | +1.6% |
| TEN | 53.0% | 54.5% | +1.5% |
| MIN | 51.8% | 52.7% | +0.9% |
| LAC | 62.4% | 63.3% | +0.9% |
| BAL | 42.8% | 43.2% | +0.4% |
| CIN | 67.2% | 65.7% | -1.5% |
| KC | 69.2% | 67.4% | -1.8% |
| ARI | 59.8% | 57.2% | -2.6% |
| BUF | 58.6% | 55.6% | -3.1% |
| DAL | 60.3% | 57.2% | -3.1% |
| JAX | 55.3% | 52.2% | -3.1% |
| PIT | 59.5% | 56.1% | -3.4% |
| CAR | 59.6% | 56.1% | -3.5% |
| LAR | 61.5% | 57.9% | -3.6% |
| CLE | 62.4% | 58.8% | -3.6% |
| HOU | 54.8% | 50.6% | -4.2% |
| DEN | 55.4% | 50.6% | -4.8% |
| GB | 61.7% | 55.5% | -6.2% |
| ATL | 64.5% | 58.1% | -6.5% |
| PHI | 53.6% | 46.5% | -7.1% |
| NYJ | 61.1% | 53.6% | -7.5% |
| CHI | 65.2% | 56.8% | -8.4% |
| WAS | 56.1% | 45.0% | -11.1% |