How Offensive Line Play Impacts Fantasy Football

Fantasy football is hard. Each year begins anew with a draft class chock full of names you’ve likely only heard of in the last two months, free agent signings with unknown statistical impact, coaching hires, and coordinator promotions that can and will affect play calling. It’s a lot to wrap your head around. But this doesn’t stop us from logging on and scouring the internet for edges on our opponents through twitter, draft guides and, of course, 4for4, one of the most useful tools you can be using. Yet amongst the thousands of articles and tweets at your disposal, there is still a key component left out by the most astute writer’s analytical process: the offensive line.
Outlier plays (and players) can make “broken” plays or scramble drills make it seem like talent can rise above a lack of blocking. Maybe it can, but not for a sustained amount of time. What we’re looking for from our fantasy players is predictability, and in our season-long leagues, consistency. What is consistent is the fact that all quarterbacks in the league have a lower QBR when pressured than when kept clean. Relating to fantasy scoring, passer rating correlates to fantasy points more than any other quarterback stat, including completions, interceptions, yards and touchdowns.
For the remainder of this article I’ll be explaining the methods to the madness of quantifying offensive line play, and exactly how we can translate that into actionable information as it pertains to counting stats and fantasy football.
Relevant Offensive Line Statistics
Below are the basic stats I used to create the metric that ranks each team’s offensive line. Weighted in terms of importance, the final score attempts to measure exactly how much an O-Line will help or hurt the output of a team's fantasy production.
- QB Hits Allowed – Simply, the number of times a team’s quarterback was hit by the defense during a pass play.
- Adjusted Sack Rate – From Football Outsiders, “Adjusted Sack Rate, which gives sacks (plus intentional grounding penalties) per pass attempt adjusted for down, distance, and opponent.” My favorite part of this stat is the down and distance bit of the metric—it weighs a drive-killing sack on 3rd-and-1 more heavily than a 3rd-and-25 sack during a fledgling drive.
- Adjusted Line Yards – Coming from FO again, this formula assigns responsibility to the offensive line to varying degrees depending on the length of a run (0–4 yards, 5–10 yards, 11+ yards and loss of yardage). Those numbers are adjusted by “down, distance, situation, opponent and the difference in rushing average between shotgun compared to standard formations”
- Experience – This stat comes straight from NFL.com and is the total combined career starts for the two guards, two tackles and center on a team with the most starts in the current season. Though it may be difficult to see how career starts can be used in predictive analytics, I believe the higher the number of career starts for a given team from year-to-year, the less fluctuation we will see from on-field performance. An 8-year veteran is less likely to see the drastic uptick in performance we may come to expect from a second- or third-year player.
- Number of Different Starters – The explanation is in the title; how many different offensive linemen started for a given team over the course of the year. The reason I’m not using “games played” as opposed to “games started” is an attempt to weed out late-game substitutions or minor “tweak” injuries which sideline a player for minutes at a time. Adding this statistic to our data sheet can give a quick look at teams who had consistent line play—such as the Rams who only started five lineman all season—and the other end of the spectrum, teams who had trouble with injuries—such as the Jaguars who had to start 12 different players across the line in 2018.
- Number of Rookies – This is simply the number of rookies who logged at least one snap on the O-Line throughout the season. This will make a quick reference point for teams still developing youth in the trenches. A team like Arizona (four different rookies took snaps) was still looking for their guys throughout the season while the Patriots (zero rookies took a single snap) went into the season chock full of veteran options
- Number of Offensive Line Penalties – This incorporates all penalties assessed to offensive linemen on a team, though holding calls and false starts make up a vast majority of the numbers. I’ve decided to include all penalties, whether accepted or declined, as it is not possible to parse out exactly whether a call should have been made (or accepted) without watching each penalty individually. And believe you me, we both have better things to be doing with our time. Though this is not an all-encompassing stat for judging a team’s discipline, it’s important to see which teams have been more likely to kill drives with mistakes. Of course, there are many other factors in play here but a quick example nonetheless; the Saints committed the fewest amount of O-Line penalties (a staggering 15!) and ended the season as the third-highest scoring offense in the league. Washington had the most penalties (56) and finished as the fourth-lowest scoring team in the league.
Let’s apply these metrics with some good old-fashioned film watching and explain how this methodology can be used to create a ranking. Rankings will be focused on how effective an O-Line is in reference to fantasy football production, and as such, metrics like Adjusted Line Yards are weighted more heavily than Number of Rookies.
Select Rankings and 2018 Performance
#4 - Los Angeles Rams
Key Stats – 5.49 Adjusted Line Yards (1st), 5 Different Starters (1st)
The Rams were a model of consistency in 2018, the only team in the NFL to get away with starting the same five guys for all 16 games of the regular season. According to ESPN Stats & Information, L.A. has had their offensive line intact for more snaps (1,098), yards gained (7,118) and touchdowns (56) than any other team. Coincidentally enough, their Super Bowl opponent New England Patriots were in second place in all three categories. Cohesion across the offensive line is essential to being on the same page. This cohesion went a long way towards giving the Rams the best Adjusted Line Yards in the league (Patriots were third—seeing a trend here?). While the genius of Sean McVay’s scheme can explain much of their success (Todd Gurley ran into an 8-man box only 8.2% of the time) on the ground, there’s no denying the offensive line shouldered their fair bit of the work. Remember when C.J. Anderson went from sitting on his couch to winning DFS tourneys within a four-day span? Anderson carried the ball 43 times and gained 299 yards in the last two games of the season, and that may be the most telling stat of them all.
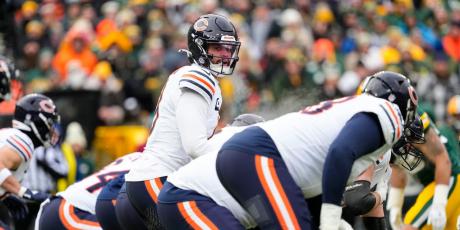
#12 – Cleveland Browns
Key Stats – 71 QB Hits Allowed (6th), 4.24 Adjusted Line Yards (18th)
Week 8 was an interesting time in Cleveland. After a very typical 2-5-1 start and an afternoon showcasing two offensive tackles being overmatched by the Steelers’ T.J. Watt and Bud Dupree, both OC Todd Haley and head coach Hue Jackson were proverbially chucked into Lake Erie. The team would finish out the season 5-3 and put up 400+ yards of total offense in half of those games behind new OC Freddie Kitchens and an offensive line continuing to coalesce as 2018 came to a close. Over the second half of the season, the O-Line was charged with a minuscule five sacks allowed, including a three-game stretch without allowing a single sack, the franchise’s longest span since 1988.
Baker Mayfield was the clear winner of the change in philosophy in the offense and the improved play of right tackle Chris Hubbard and left tackle Greg Robinson. The stats below show the split in Mayfield’s stats before and after the switch to Freddie Kitchens, and conveniently enough, coincide with Greg Robinson getting the start at left tackle from Week 9 through the end of the season.
| With Hue Jackson/Todd Haley (6 Games) | Kitchens at OC/Greg Robinson at LT (8 Games) |
|---|---|
| 245 yards, 1.3 TD, 1 INT, 3.3 sacks per game | 281.8 yards, 2.4 TD, 1 INT, 0.6 sacks per game |
With extra time and comfort in the pocket, Baker was able to push the ball down the field and flash some of his play-making brilliance.
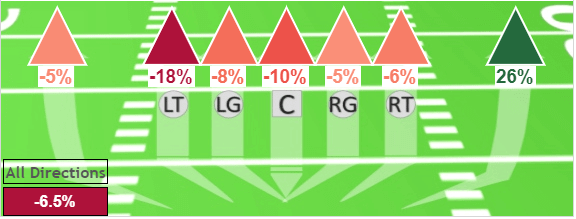
A tale of two seasons for a second rookie would show up in the running game as well, with Nick Chubb having a brilliant second half. Below are running game splits from SharpFootballStats.com. The first visual is the Browns’ running game compared to the league-average success rate through the first eight weeks of the season. As you can see, they were altogether below-average, but their worst performance was on runs behind the left tackle.
The next graphic depicts their rushing success from Weeks 9 to the end the of season.
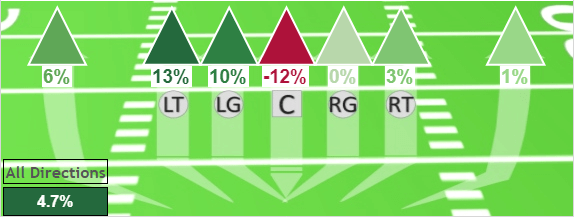
Running through the C or D gap on the left side went from a weakness of the offense to a strength and helped, in part, to deliver Chubb double-digit fantasy scoring games in seven of the last eight, including a slate-topping 32.9 points in Week 10.
#19 – Dallas Cowboys
Key Stats – 9.70% Adjusted Sack Rate (28th), 4.61 Adjusted Line Yards (9th)
What has long been considered Dallas’ strength took a bit of a drop in 2018. The star of the line and one of the best tackles in the league, Tyron Smith, was dealing with lingering back issues throughout the season. Every time Cameron Fleming is out there instead of Tyron it comes as a detriment to the team. Next to left tackle, rookie Connor Williams was also in and out of the lineup after a November 5 injury saw him get replaced by journeyman Xavier Su’a-Filo, who manned the left guard slot until the playoffs began. This is all to say the left side of the line was never allowed to settle in for the long haul of the season, as new faces were set in place to protect the backside of Dak Prescott from week-to-week. This 9.7% Adjusted Sack Rate is by far the worst the Cowboys have seen since at least 2010 and resulted in Offensive Line Coach Paul Alexander getting canned during the Week 8 Bye.
While Prescott was on his way to setting career highs in sacks (56) and fumbles (12), the line was still able to make hay of the running game. Zeke Elliot finished with 20+ PPR fantasy points per game for the third time in three years as he ended up as the PPR RB5 despite a career-low six touchdowns. If it weren’t for someone named Saquon Barkley, Elliot would have once again led the league in 20+ yard rushes; he certainly has the burst and long speed to deliver explosive runs when the line creates holes. It’s hard to add any more value to Ezekiel’s ballooned worth in fantasy at this point, but he will indeed be even more valuable if Tyron Smith, a second-year Connor Williams and All-Pro Center Travis Frederick can all return to health before the 2019 season.
#32 – Houston Texans
Key Stats – 11.50% Adjusted Sack Rate (32nd), 168 games of Experience (32nd)
Despite a sack rate that would make David Carr blush, Deshaun Watson became the first quarterback in history to pass for 4,000 yards with 25 touchdowns and rush for another 500 yards and five scores. The second-year quarterback accounted for 4,716 total yards while trudging through muddy pockets for 16 games, evading pressure when possible and hitting throws while being hit himself. Which is great because he was hit a league-leading 126 times.
Opposing defenses feasted coming off Houston’s edge in 2018, and sophomore offensive tackle Julie’n Davenport sadly took the brunt of the punishment. He led the team in all the major categories: sacks allowed, hits, hurries, pressures and penalties. When Seantrel Henderson (one of the only veterans on the team) was lost for the season due to injury after 11 snaps of the opener, all hell broke loose. They tried third-round rookie Martinas Rankin (who is likely a guard) at left tackle for the next four weeks before benching him and supplanting him with Davenport. Depth piece Kendall Lamm was forced to start 15 games across from Davenport at right tackle and all this combined to make the Texans the least experienced offensive line in the NFL, 40 fewer games of experience than the team in 31st place.
The hits just keep on coming as Houston also ranked in the bottom-five in Adjusted Line Yards (3.93), contributing to yet another perfectly mediocre output from Lamar Miller, who finished as the PPR RB23 for what feels like the sixth year in a row. The state of this offensive line may be benefitting at least one player—the more Deshaun Watson must leave the pocket and run around looking for options, the longer DeAndre Hopkins can freestyle and work on his defender. His 337.5 PPR points were a career high and catapulted him to the overall WR1 for the year.
The Bottom Line
In essence, good O-Line = good for the offense. I trust the deeper we dig into correlation and the more we understand about how each team’s offensive line is shaping up, the more we can use it as a predictor of future success for each team’s fantasy pieces.
As the offseason trudges along, there will be vast changes for some offensive lines and some consistency in others. Free agent acquisitions, retirement and the NFL draft will affect these offensive line rankings and in turn, change the perceived value of their skill position team mates. We’ll be looking over the coming months at how the behemoths of the field will boost or hinder our most precious fantasy commodities for the 2019 season.