Week 2 Monday Night Single-Game NFL DFS: Top FanDuel & DraftKings Plays

Welcome to the showdown breakdown for the first of two Monday Night Football matchups for Week 2. The early game features the new-look Saints, now led by Derek Carr, who didn’t blow the roof off the Superdome in a Week 1 victory, but instead did just enough to overcome the visiting Titans. Meanwhile, the Panthers were unable to keep things close with the Falcons on the road, though their new quarterback did show several signs of promise. Still, after the Saints failed to execute last weekend, and the Panthers working through the growing pains of trotting out a rookie quarterback, this low 40.0 total is justified. Still, there are some intriguing matchups and value plays that make this game very enticing for single-game DFS players.
Game Environment
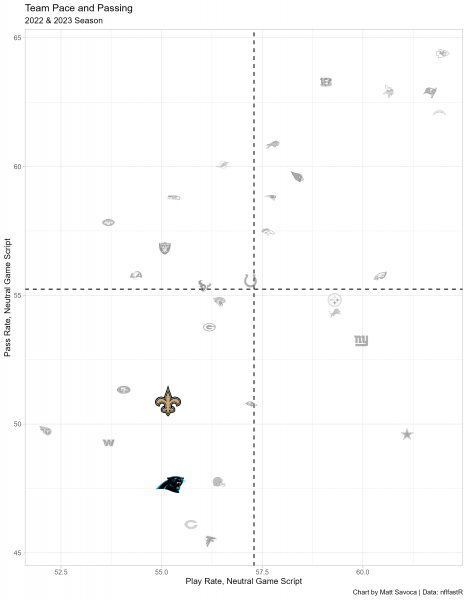
This chart represents the general offensive strategies for each team when the game outcome is still in question (win probability between 20% and 80%). The final two minutes of each half are also excluded. We’ll include last year’s statistics through Week 4 of the regular season. Teams in the upper-right quadrant pass more often and play faster than the average NFL team in neutral game scripts, and conversely, teams in the lower-left quadrant play slower and run more often than the average NFL team.
Saints (-3, 21.5) @ Panthers (+3, 18.5); Over/Under 40.0
These two teams combined for a pitiful 26 points in Week 1. And while the chart above may include data from last year when both squads had different quarterbacks, there’s still a plethora of evidence that these teams play slower and pass less than the average team in neutral game scripts. Carr’s Raiders were slightly more uptempo last season, and we saw some signs that the Saints will play faster this year as well, with their average seconds per play in Week 1 speeding up by nearly 10% compared to last year’s average.
The Panthers, now led by number-one overall pick Bryce Young, played at roughly the same league-average play rate as they did in 2022. But they seemed more willing to put the ball in their young quarterback’s hands. While the rookie’s debut was a forgettable one, the Panthers finished their Week 1 loss with 38 pass attempts, nine passes above their 2022 average.
The sample sizes may be limited, but there is little in the data pointing toward a shootout or even a game that goes over the 40.0 point total, where it currently sits. While a few key breaks can completely alter any game’s trajectory, this looks like a game where both teams will be content to outlast their opponents rather than outscore them.
Quarterback Analysis
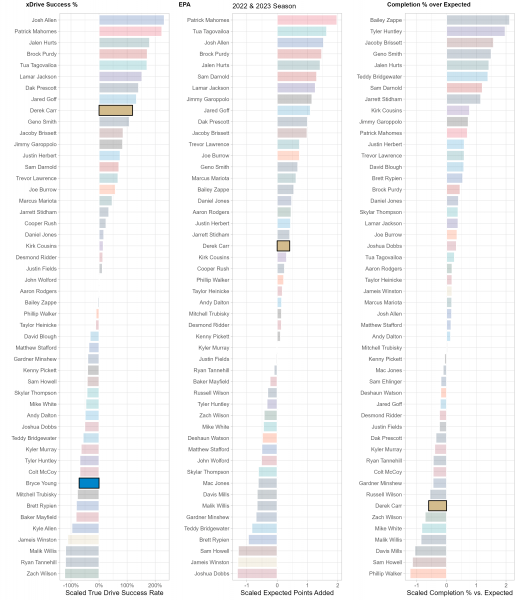
While there may be 22 people on the field for every play, each play and game is heavily dictated by the performance of each team’s quarterback. While efficiency isn’t everything for quarterbacks, it is the best indicator of future performance, so we use a trio of metrics to suss out top performers at the position compared to lackluster ones. xDrive Success %, or True Drive Success Rate, is a measurement of a QB’s ability to turn drives into scores weighted by sample size. EPA or Expected Points Added, is a measurement of the QB’s contribution, both running and throwing, to the team’s scoring and production vs. the average NFL team. Completion % over Expected (CPOE)represents the accuracy and efficiency of a QB’s passes compared to league expectations.
We should be paying almost no attention to Young’s efficiency numbers at this point, but spoiler alert: they’re not good. There’s no need to go into great detail about how bad the numbers are, instead, understand that, with such a small sample size, Young has a chance to have his metrics still swing wildly in the other direction with one strong performance. Because of the large amount of uncertainty, it is almost better to simply assume replacement-level efficiency in all three categories until we have more information. It should be noted, however, that Young ranked in the top 25th percentile of all QB prospects since 2013 in yards per attempt and in QBR, which points to the possibility of future efficiency at the NFL level.
Meanwhile, Derek Carr’s metrics are all over the place on the chart above, and to an extent, explain why the Raiders may have been ready to make a change from Carr after eight seasons. Carr ranked well below average in terms of accuracy in 2022, ranking among the likes of Zach Wilson in completion percentage vs. expected. He was just a bit above league average in EPA per game, and yet, he found significant success in terms of his ability to turn drives into scores. And to Carr’s credit, the Raiders were tied for the 10th most passing touchdowns per game a season ago. PFF graded them as the 12th-best offense. But this was mostly on the backs of stellar lines for Vegas' offensive line (the team’s passing grade was 19th)—the Saints line graded in the bottom-10 in 2022, and bottom-five in the first game of 2023.
Core Plays and Auxiliary Options

- DFS & Season-Long Content
- Lineup Generator
- Optimal Cash & GPP Lineups
- Floor & Ceiling Projections
- -Leverage Scores
- -...and much much more!