The Definitive Guide to Stacking on FanDuel

You don't need me to tell you that stacking, or playing players in the same game whose production is correlated, plays a pivotal role in tournament lineup construction. Browse winning tournament lineups, and you'll usually see at least one pair of teammates.
This article will examine stacking on FanDuel from a data-driven standpoint. Specifically, it will answer the following questions:
- What are the correlations between each position?
- What are the odds of a stack "hitting"?
- What are the optimal stack combinations, both in terms of position and in terms of number of players stacked?
- Is there merit to stacking not only players on the same team, but also players on the opposing team, within a lineup?
- What is the relationship between Vegas lines and stacking?
Methodology & Accurately Determining Positional Labels (WR1/WR2, etc.)
The dataset used in this study contains all NFL games from 2013–2017. For each game, FanDuel points scored in each game were tabulated for the following positions on each team:
- QB
- RB1, RB2
- WR1, WR2, WR3
- TE1
- DST
- K
Perhaps the greatest challenge when doing a study with this methodology is breaking the positions down into their specific roles. That is, it's obvious that QBs and WRs are correlated, but what we really want to know is which WR we should be stacking. For example, what are the odds of a QB-WR1 stack hitting compared to a QB-WR2, or a QB-WR1-WR2?
We could have simply determined WR1, WR2, and so on based on their finish in FanDuel points for their team over the full season, but that would be backward-looking and ultimately not very accurate. For instance, even though Sterling Shepard finished the season as the Giants' leader in WR fantasy points, it would have been incorrect to label him as the team's WR1 for Weeks 2-5 when Odell Beckham was healthy.
Instead, for each game, we labeled players at RB and WR based on where they ranked on their team in terms of projected FanDuel points (using 4for4's projections) for that game. This allowed us to not only capture dynamic role changes when players miss games or are promoted/demoted, but it's also predictive since projections are available prior each game. Going back to our previous example, Beckham would be designated as New York's WR1 for Weeks 2-5, but in the rest of their games, Shepard would be designated as the WR1.
FanDuel Stacking Correlation Matrix
Here is the FanDuel correlation matrix for each position that shows how correlated the positions are to each other:
FanDuel Correlation Matrix (2013–2017)
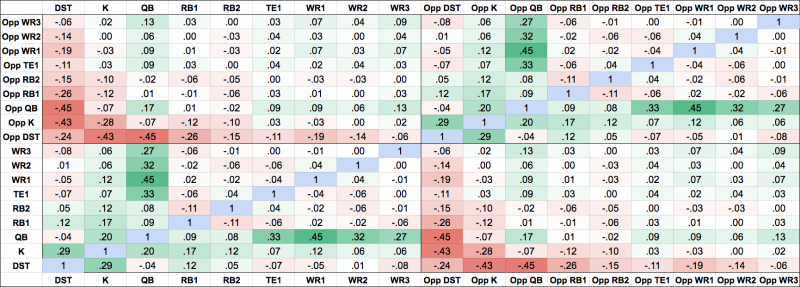
To make the chart bigger, right click, view image in a new tab, and zoom in.
Before we dive in and answer questions about optimal stacks, the odds of specific stacks hitting, and the like, here are some general highlights and takeaways from the correlation matrix:
- QB-WR1 is by far the strongest positively correlated stack. The correlation is .12 higher than the correlation between QB and his next highest receiver. Stacking a QB and his top receiver is the bread-and-butter of stacking.
- QB-TE1 is the next most strongly correlated stack after QB-WR1, narrowly edging QB-WR2. While QB-TE1 and QB-WR2 have the same exact correlation on DraftKings, the QB-TE1 is .01 higher on FanDuel. This is likely due to the fact that there are no yardage bonuses, which tend to hurt WRs more than TEs.
- QB-Opp DST is by far the strongest negatively correlated stack. One way to use this information is when making contrarian selections. You can potentially gain a big edge if a highly owned QB has a bad game and you've rostered the opposing DST, and vice-versa.
- Some positive correlation exists between QB and members of the opposing passing game, and especially between opposing QBs. FanDuel is a one-QB site, but this has implications as far as player exposure. If you are creating stacks for one QB in a given game, you should think about having exposure to the opposing QB. This is also true to a lesser extent for WRs and TEs -- if you're going to have exposure to receivers on opposing teams, it can be advantageous to pair them up in the same lineup.
- There is some correlation between RB1 and DST, but it is mild compared to QB-WR1, which is over four times as high, and QB-WR2/QB-TE1, which are three times as high. This suggests that we shouldn't necessarily be building lineups around RB-DST stacks the way we would QB-receiver, but instead try to pair a RB with his DST if we had planned on having exposure to both anyway.
- There is a slight positive correlation between a QB and his RBs. Don't fear the QB-RB stack, which subsequent data will show is an underrated pairing.
- DST-K has a correlation that is nearly on par with the QB-receiver stacks. The .29 DST-K correlation trails QB-TE1 by just .04 and QB-WR2 by just .03, and is stronger than QB-WR3 (.27).
Going Beyond Correlation
As explained in the DraftKings piece, the correlation matrix looks fancy and is certainly a valuable tool for understanding the relationships between each fantasy position, but it doesn't paint the entire picture when it comes to stacking. It still leaves questions unanswered, such as what the odds of a particular stack hitting are, how Vegas lines affect stacks, and more. Therefore, throughout the rest of this writing, we will look at stacks primarily through the lens of how many points they combined to score, rather than their value (points divided by salary). The reason I chose this vantage point is that the amount of salary you spend on a stack will ultimately come down to what kind of value is available at other positions. In the end, you'll usually need at least 200 points or more to win a tournament. In other words, you need all the players in your lineup to score a lot of points, regardless of salary.
Two-Man QB Stacks
Below is a table showing the odds of two-man QB stacks combining to eclipse various FanDuel-point thresholds. Since an average of 25 FanDuel points per (non-DST, non-K) lineup slot would provide a 175-point floor before taking into account DST and K, I set the floor at 50 for two-man QB stacks.
| Stack | 50+ | 55+ |
|---|---|---|
| QB+WR1 | 7.5% | 4.8% |
| QB+RB1 | 4.2% | 1.8% |
| QB+WR2 | 2.8% | 1.3% |
| QB+TE1 | 2.9% | 1.6% |
| QB+WR3 | 1.6% | 0.0% |
| QB+DST | 1.2% | 0.3% |
| QB+RB2 | 1.0% | 0.3% |
| QB+K | 0.5% | 0.1% |
The first thing that stands out is that the QB-WR1 stack is clearly in a league of its own compared to the other two-man QB stacks.
The second big takeaway is that QB-RB1 is comfortably in second place in terms of combining for at least 50 FanDuel points, and is in second place in terms of combining for 55 as well. As you will see repeatedly throughout this article and my previous piece on DraftKings stacking, QB-RB1 is a very viable stack. Owning a QB and RB1 on the same team in a game where the offense goes off can net you exposure to every single touchdown that offense scores.
I mentioned earlier that 25 points per slot is generally what all of your players (at least all of them except for K and DST) should be capable of scoring. So let's look at stacking from a different perspective. Since by rostering any QB, you're implying he has at least 25-point upside, let's see what happens when a QB actually scores 25 or more.
First we'll look at how what percentage of the time each position scores 25 or more when the QB scores 25 or more:
| Pos | Avg | 25+ |
|---|---|---|
| WR1 | 18.8 | 26.3% |
| Opp QB | 19.9 | 25.7% |
| Opp WR1 | 14.1 | 16.3% |
| Opp RB1 | 13.1 | 10.1% |
| RB1 | 12.8 | 7.7% |
| TE1 | 10.8 | 6.7% |
| WR2 | 12.0 | 6.2% |
| Opp TE1 | 8.4 | 2.9% |
| WR3 | 8.0 | 2.9% |
| Opp WR2 | 8.6 | 2.4% |
| Opp WR3 | 6.6 | 2.4% |
| DST | 7.0 | 0.5% |
| Opp DST | 3.2 | 0.5% |
| RB2 | 6.4 | 0.0% |
| Opp RB2 | 5.6 | 0.0% |
| K | 8.2 | 0.0% |
| Opp K | 6.7 | 0.0% |
In games where the QB scores 25 or more, WR1s are unsurprisingly the clear beneficiaries, averaging 18.8 points and scoring 25 or more 26.3 percent of the time, odds that are nearly four times as much or more than the odds of any other player you could stack a QB with on his own team.
We again see evidence of the RB1 being not only a viable stacking partner with his QB, but the second-best stacking partner for a QB besides his WR1. The RB1 scored 25-plus more than every receiver except the WR1 when the QB eclipsed the 25-point mark.
We also again see the strong correlation between a QB and members of the opposing passing team, although the correlation is not as strong as it is on DraftKings, likely due to the fact that FanDuel has no yardage bonuses. When a QB posts a 25-point game, there's a 25.8 percent chance the opposing QB will too. In addition, there's a 16.3 percent chance the opposing WR1 will do so. In fact, when a QB puts up a 25-point game, the opposing QB and WR1 are more likely to also put up a 25-point game than anyone on the QB's own team besides his WR1.
Now let's take a look at which positions gain the most value when a QB scores 25 or more. We'll do this by comparing each position's average FanDuel points when a QB scores to 25 to their overall average in all games.
| Pos | Avg in All | Avg in QB 25+ | % +/- |
|---|---|---|---|
| WR1 | 12.1 | 19.0 | 57.0% |
| WR3 | 5.2 | 8.0 | 53.8% |
| TE1 | 7.3 | 10.8 | 47.9% |
| WR2 | 8.3 | 12 | 44.6% |
| Opp WR3 | 5.2 | 6.6 | 26.9% |
| Opp WR1 | 12.1 | 14.1 | 16.5% |
| Opp QB | 17.1 | 19.8 | 15.8% |
| Opp TE1 | 7.3 | 8.4 | 15.1% |
| K | 7.3 | 8.2 | 12.3% |
| RB2 | 5.8 | 6.4 | 10.3% |
| RB1 | 12 | 12.8 | 6.7% |
| Opp RB1 | 12 | 12.7 | 5.8% |
| Opp WR2 | 8.3 | 8.6 | 3.6% |
| Opp RB2 | 5.7 | 5.6 | -1.8% |
| Opp K | 7.3 | 6.7 | -8.2% |
| DST | 7.7 | 7.0 | -9.1% |
| Opp DST | 7.7 | 3.2 | -58.4% |
This sheds some more light on the positional order in the table before this one. While RBs and members of the opposing passing game move down the list on this table, receivers all move to the top. This table matches up with what most us of would suspect: that receivers have the most to gain when a QB has a big game.
QBs, WR1s, and RB1s are most likely to have 25-point games of all the positions, and those chances are further maximized when a QB scores 25. Since you want to be targeting those high scores rather than just an increase in value over a player's norm, looking only at the data above would ultimately prove to be limiting, and I'd still refer more to the chart before this one when making stacking decisions. For example, a WR3 that outperforms his normal production by 54 percent would still be largely irrelevant if he's still only scoring 12-16 points instead of 6-8 points—you need him to hit the mid-20s. The main thing I would take from the data directly above is that a QB who has a big game has a positive effect on nearly every other player in the game on both teams.
Three-Man QB Stacks
Next up: three-man QB stacks. Here are the odds of each of the various pairings hitting:
| Stack | 75+ | 90+ |
|---|---|---|
| QB+WR1+RB1 | 2.6% | 0.5% |
| QB+WR1+WR2 | 2.2% | 0.3% |
| QB+WR1+TE1 | 1.6% | 0.3% |
| QB+WR2+RB1 | 1.2% | 0.3% |
| QB+WR1+WR3 | 1.0% | 0.0% |
| QB+WR1+RB2 | 0.9% | 0.1% |
| QB+TE1+RB1 | 0.7% | 0.1% |
| QB+WR3+RB1 | 0.8% | 0.2% |
| QB+WR2+TE1 | 0.5% | 0.1% |
| QB+RB1+RB2 | 0.4% | 0.0% |
| QB+WR3+TE1 | 0.4% | 0.0% |
| QB+WR2+WR3 | 0.4% | 0.1% |
| QB+TE1+RB2 | 0.2% | 0.1% |
| QB+WR2+RB2 | 0.3% | 0.0% |
| QB+WR3+RB2 | 0.3% | 0.1% |
The odds of any three-man QB stack hitting—averaging 25 points per player—top out at just 2.6 percent, which is roughly a third of the odds of a QB-WR1 stack hitting (7.5), but in line with some of the other two-man pairings.
With the two-man stacks, you could subtly see by looking at the percentages of each hitting that stacking on FanDuel might not be quite as effective as on DraftKings, but a lot of the reason two-man pairings on FanDuel hit 50 less than on DraftKings is that DraftKings has higher scores, period.
However, with the three-man stacks, we can see more clearly that stacking isn't quite as effective on FanDuel as it is on DraftKings. On FanDuel, the top three-man stack hits roughly only a third as much of the time as the top two-man stack, while on DraftKings the top-three man stack hits more than half as much of the time as the top two-man stack. This likely has to do with the fact that FanDuel is not a full-PPR site and does not have yardage bonuses.
For example, a 20-yard pass that puts the QB over 300 yards and the WR over 100 yards would result in an extra 6.5 points on DraftKings that the pairing wouldn't score on FanDuel. On FanDuel, scoring is more heavily determined by touchdown distribution, so it's harder for three-man combos to hit as a unit unless things break right in that area. Three-man stacks (and as you'll see in a moment, four-man stacks) can be viable at times, but they are very risky and you shouldn't overexpose yourself to them or risk diminishing returns. The Vegas Lines section of this article will provide insight into when the right time for a three-man stack is.
You'll notice that the RB1 is a good stacking partner for the QB, appearing in the optimal three-man stack in terms of scoring 75-plus and 90-plus.
The top three (and five of the top six) three-man stacks all include the WR1, so it doesn't look like a smart idea to fade the WR1 if you're going for a three-man stack.
Now let's look at how each positional pairing in a three-man QB stack fares when the QB scores 25 or more:
| Duo Paired w/ 25+ Pt QB | Avg | Both 25+ | 50+ Combined |
|---|---|---|---|
| WR1+WR2 | 31.0 | 1.0% | 8.1% |
| WR1+RB1 | 31.7 | 1.4% | 6.2% |
| WR2+RB1 | 24.8 | 0.0% | 3.3% |
| WR1+TE1 | 29.8 | 0.5% | 2.9% |
| WR1+WR3 | 27.0 | 0.0% | 2.4% |
| TE1+RB1 | 23.6 | 0.0% | 2.4% |
| WR1+RB2 | 25.3 | 0.0% | 1.4% |
| WR2+TE1 | 22.8 | 0.0% | 1.0% |
| WR3+RB1 | 20.8 | 0.0% | 1.0% |
| WR2+WR3 | 20.0 | 0.0% | 0.5% |
| WR3+TE1 | 18.8 | 0.5% | 0.5% |
| RB1+RB2 | 19.1 | 0.0% | 0.5% |
| WR3+RB2 | 14.3 | 0.0% | 0.5% |
| WR2+RB2 | 18.3 | 0.0% | 0.0% |
| TE1+RB2 | 17.2 | 0.0% | 0.0% |
No major surprises here that we didn't already learn from the data in the previous table. The RB1 continues to emerge as a viable stacking partner with the QB, appearing in two of the top-three 3-man QB stacks.
It might be obvious, but I'll still point out that the table above serves as an excellent illustration of why we stack in the first place: While the chances of both players in each pairing scoring 25 or more each is low, the odds of both players scoring 50 or more combined is much higher—reaching eight times as much in the top stack.
Four-Man QB Stacks
Here are the odds for four-man QB stacks reaching 100 FanDuel points:
| Stack | 100+ |
|---|---|
| QB+WR1+WR2+RB1 | 0.8% |
| QB+WR1+TE1+RB1 | 0.5% |
| QB+WR1+WR2+TE1 | 0.5% |
| QB+WR1+WR2+RB2 | 0.5% |
| QB+WR1+WR3+RB1 | 0.5% |
| QB+WR1+WR2+WR3 | 0.2% |
| QB+WR1+RB1+RB2 | 0.3% |
| QB+WR1+WR3+TE1 | 0.1% |
| QB+WR1+TE1+RB2 | 0.3% |
| QB+WR2+WR3+RB1 | 0.1% |
| QB+WR2+RB1+RB2 | 0.4% |
| QB+TE1+RB1+RB2 | 0.1% |
| QB+WR2+WR3+TE1 | 0.3% |
| QB+WR3+TE1+RB2 | 0.1% |
| QB+WR1+WR3+RB2 | 0.1% |
| QB+WR3+TE1+RB1 | 0.1% |
| QB+WR2+WR3+RB2 | 0.1% |
| QB+WR3+RB1+RB2 | 0.1% |
The odds for the highest four-man stack to average 25 points per slot (0.8 percent) are considerably lower than the odds for the highest two-man (7.5) and three-man (2.6) stacks to do so. All five of the four-man QB stacks that have at least a 0.5-percent chance of scoring 100-plus contain the WR1, and four out of the five contain an RB.
| Trio Paired w/ 25+ Pt QB | Avg | % All 25+ | % All 100+ Combined |
|---|---|---|---|
| WR1+WR2+RB1 | 43.7 | 0.0% | 1.9% |
| WR1+RB1+RB2 | 38.0 | 0.0% | 0.5% |
| WR1+WR3+TE1 | 37.8 | 0.0% | 0.5% |
| TE1+RB1+RB2 | 29.9 | 0.0% | 0.5% |
| WR3+RB1+RB2 | 27.1 | 0.0% | 0.5% |
| WR1+TE1+RB1 | 42.6 | 0.0% | 0.0% |
| WR1+WR2+TE1 | 41.8 | 0.0% | 0.0% |
| WR1+WR3+RB1 | 39.7 | 0.0% | 0.0% |
| WR1+WR2+WR3 | 39.0 | 0.0% | 0.0% |
| WR1+WR2+RB2 | 37.3 | 0.0% | 0.0% |
| WR1+TE1+RB2 | 36.1 | 0.0% | 0.0% |
| WR1+WR3+RB2 | 33.3 | 0.0% | 0.0% |
| WR2+WR3+RB1 | 32.3 | 0.0% | 0.0% |
| WR3+TE1+RB1 | 31.6 | 0.0% | 0.0% |
| WR2+RB1+RB2 | 31.1 | 0.0% | 0.0% |
| WR2+WR3+TE1 | 30.8 | 0.0% | 0.0% |
| WR2+WR3+RB2 | 26.3 | 0.0% | 0.0% |
| WR3+TE1+RB2 | 25.2 | 0.0% | 0.0% |
Once again we see the benefits of stacking in that the odds are actually zero that all three players paired with a QB in a four-man stack when he scores 25-plus will all also score 25-plus each; meanwhile, the odds of all four players scoring 100 combined are higher for some stacks. However, you can see that four-man QB stacks have little chance of success on FanDuel and should mostly be avoided.
Running Back-Defense Stacks
The logic for the RB-DST stack makes sense in theory: if a team's defense is successful, that most likely means that team will be playing with a lead and therefore the RB will see an increased workload to help kill the clock. However, a defense can do well in real life without necessarily piling up a ton of sacks or turnovers needed for a high amount of FanDuel points, so the correlation between RB and DST is relatively mild. Here is the data (I set the floor for a successful RB-DST stack at 40 rather than 50, since DSTs score less than other positions):
| Stack | 40+ | 45+ |
|---|---|---|
| RB1+DST | 4.0% | 1.7% |
| RB2+DST | 0.5% | 0.3% |
An RB1-DST stack will only hit 40 points 4.0 percent of the time, and the chances of the stack eclipsing 50 are minimal. The RB2 shouldn't be an option.
Over the last three seasons, DSTs scored 15 or more FanDuel points 14.0 percent of the time, or 4.22 times per week, so scoring 15-plus essentially equates to having a top-five DST in a given week. How did RBs perform when a DST scored 15 or more?
| Pos | Avg | 25+ |
|---|---|---|
| RB1 | 13.3 | 9.3% |
| RB2 | 6.8 | 1.4% |
When a DST scores 15 or more, the RB1 does get a slight bump, scoring 25-plus at a 9.3-percent clip compared to their 6.6-percent rate in all games. The RB-DST stack can be a solid option when you can make it happen naturally, but as I mentioned earlier, it doesn't make a ton of sense to build your lineup around it.
Defense-Kicker Stacks
Both defense and kickers tend to be most successful in the same type of situation with regards to Vegas lines: as favorites with large spreads. Therefore, it is no surprise that there is some correlation between DSTs and kickers. I settled on 15 points as a reasonable floor to examine the stack, as combining 30 points from DST/K with the 175 points from the other seven slots would result in a lineup with a floor of 205 points. Here are the odds of a DST-K stack hitting:
| Stack | 30+ | 35+ | 40+ |
|---|---|---|---|
| DST+K | 5.7% | 1.8% | 0.5% |
Not bad. The odds of a DST-K stack hitting are higher than the odds for all but one two-man QB stack, all the three- and four-man QB stacks, and the RB-DST stack.
To find out which of the two positions is more important when building a DST-K stack, let's look at how each one performs when the other scores 15 or more:
| Pos | Avg | 15+ |
|---|---|---|
| K | 9.2 | 5.6% |
| Pos | Avg | 15+ |
|---|---|---|
| DST | 10.4 | 24.5% |
A DST is more likely to have success while a kicker is having a big game than a kicker is likely to have success while a DST is having a big game. When a kicker has a game of 15 or more points, DSTs score 15-plus points as well at a rate of 1.75 times what they normally do, while when a DST has a game of 15 or more points, kickers score 15-plus points as well at a rate of only 1.59 times what they normally do.
A DST-K stack can be a viable option that can be just as effective as many of the other stacking combinations outside of QB-WR1.
Vegas Lines
Let's wrap up by comparing stacks and the Vegas odds. I looked at the Vegas odds for each "successful" two-, three-, and four-man stack types.
I defined a successful stack as:
- Two-man QB stacks that score 50-plus
- Three-man QB stacks that score 75-plus
- Four-man QB stacks that score 100-plus
- RB-DST stacks that score 40-plus
- DST-K stacks that score 30-plus
As you go through the data below, keep in mind that 35.7 percent of implied team totals were 24 or higher and 12.4 percent of implied team totals were 27 or higher from 2013 to 2017.
| 2-Man Stack 50+ | Amount | Avg Team Total | Avg O/U | Avg Spread | Fav % | Tm Total 24+ | Tm Total 27+ |
|---|---|---|---|---|---|---|---|
| QB+WR1 | 115 | 24.5 | 46.8 | -2.2 | 67.8% | 56.5% | 21.7% |
| QB+RB1 | 65 | 25.4 | 47.9 | -2.9 | 72.3% | 64.6% | 33.8% |
| QB+WR2 | 43 | 25.6 | 47.6 | -3.6 | 69.8% | 62.8% | 34.9% |
| QB+TE1 | 45 | 25.0 | 47.1 | -2.8 | 66.7% | 55.6% | 35.6% |
| QB+WR3 | 25 | 24.7 | 47.5 | -1.8 | 60.0% | 52.0% | 32.0% |
-
QB-WR1 is the most effective stack, so it's no surprise that it required the lowest team total (24.5) and over/under (46.8), on average.
-
Stacks are a lot more effective on teams that are favorites. The four top two-man QB stacks were favorites at least two-thirds of the time, on average.
| 3-Man Stack 75+ | Amount | Avg Team Total | Avg O/U | Avg Spread | Fav % | Tm Total 24+ | Tm Total 27+ |
|---|---|---|---|---|---|---|---|
| QB+WR1+RB1 | 40 | 25.7 | 48.0 | -3.4 | 80.0% | 72.5% | 35.0% |
| QB+WR1+WR2 | 34 | 25.1 | 47.5 | -2.7 | 67.6% | 61.8% | 29.4% |
| QB+WR1+TE1 | 24 | 24.1 | 46.4 | -1.4 | 58.3% | 50.0% | 20.8% |
| QB+WR1+WR3 | 18 | 24.7 | 47.5 | -1.9 | 66.7% | 61.1% | 27.8% |
| QB+WR2+RB1 | 14 | 23.8 | 46.5 | 1.0 | 50.0% | 50.0% | 0.0% |
| QB+WR2+TE1 | 13 | 25.8 | 48.6 | -3.1 | 69.2% | 53.8% | 38.5% |
| QB+TE1+RB1 | 11 | 25.5 | 47.6 | -3.5 | 72.7% | 63.6% | 36.4% |
-
The three-man QB stack (QB-RB1-WR1) tends to only succeed when the Vegas odds are overwhelmingly favorable. QB-RB1-WR1 stacks were favorites when they hit 80 percent of the time on a sample size of 40; only two other stacks of any size had rates of 80 or more, and their sample sizes were 7 and 5. The average spread of -3.4 and average over/under of 48.0 are both among the highest of any stacks, regardless of size. On FanDuel, three-man stacks won't be as viable as they are on DraftKings, and it's even more important to seek out extremely favorable Vegas odds when you do choose to employ them.
| 4-Man Stack 100+ | Amount | Avg Team Total | Avg O/U | Avg Spread | Fav % | Tm Total 24+ | Tm Total 27+ |
|---|---|---|---|---|---|---|---|
| QB+WR1+WR2+RB1 | 12 | 24.8 | 47.8 | -1.9 | 66.7% | 66.7% | 25.0% |
| QB+WR1+TE1+RB1 | 7 | 24.2 | 45.1 | -3.3 | 71.4% | 57.1% | 14.3% |
| QB+WR1+WR2+TE1 | 8 | 25.6 | 48.9 | -2.3 | 62.5% | 62.5% | 37.5% |
| QB+WR1+WR3+RB1 | 7 | 25.2 | 47.1 | -3.3 | 85.7% | 71.4% | 28.6% |
| QB+WR1+WR3+TE1 | 5 | 26.5 | 48.6 | -4.4 | 80.0% | 80.0% | 60.0% |
-
As I mentioned previously, four-man stacks should mostly be avoided on FanDuel. The sample size above is too small to draw many conclusions, so if you are going to use a four-man stack, I would stick to situations where Vegas odds are extremely favorable.
| RB+DST Stack 40+ | Amount | Avg Team Total | Avg Opp Tm Total | Avg O/U | Avg Spread | Fav % | Tm Total 24+ | Tm Total 27+ | Opp Team Total < 24 | Opp Team Total <20 | Spread -3+ | Spread -6+ |
|---|---|---|---|---|---|---|---|---|---|---|---|---|
| RB1+DST | 61 | 24.7 | 21.3 | 46 | -3.4 | 70.5% | 60.7% | 26.2% | 73.8% | 31.1% | 55.7% | 34.4% |
- Nearly 75 percent of successful RB-DST stacks had an opposing team total of under 24, and over 70 percent were favorites.
-
Compared to the QB-receiver stacks, RB-DST stacks are more likely to be favorites and more likely to have a team total above 24, so you need more favorable Vegas odds for a RB-DST stack to pay off than for a two-man QB-receiver stack to pay off.
| K+DST Stack 30+ | Amount | Avg Team Total | Avg Opp Tm Total | Avg O/U | Avg Spread | Fav % | Tm Total 24+ | Tm Total 27+ | Opp Team Total < 24 | Opp Team Total <20 | Spread -3+ | Spread -6+ |
|---|---|---|---|---|---|---|---|---|---|---|---|---|
| DST+K | 88 | 23.7 | 21.1 | 44.8 | -2.6 | 68.2% | 44.3% | 15.9% | 81.8% | 38.6% | 59.1% | 28.4% |
- At 44.8, DST-K stacks have the lowest average over/under of any stack.
- A remarkable 81.8 percent of successful DST-K stacks had opponents with team totals below 24. Those are great odds, and you should be narrowing down your usage of DST-K stacks to almost exclusively include teams facing opponents with a team total under 24—it's even more important than being a favorite in this case.
Recap
- QB-WR1 is far and away the stack with the best odds of hitting.
- Although the correlations are higher for the WR2/WR3/TE1, the RB1 tends to be the second-best position to pair with a QB because this potentially exposes you to all of an offense's touchdowns in a given game.
- There is a relatively strong correlation between opposing passing games.
- K-DST stacks are just as viable as any stack outside of QB-WR1.
- RB-DST stacks are not as strong as QB stacks.
- The top three- and four-man stacks always contain the WR1.
- Three- and four-man stacks are not very effective overall, and four-man stacks especially should be mostly avoided.
Photo by Streeter Lecka/Getty Images.


