Week 13 DraftKings & FanDuel Winning GPP Lineup Review

In this space each week, I will review the winning lineups from the DraftKings Millionaire Maker and the FanDuel Sunday Million. Analyzing top lineups can help to tease out lineup-building strategies and offer clues on how you could have landed on a similar team.

DraftKings Week 13 Millionaire Winning Lineup
Ownership
| Week | QB | RB1 | RB2 | WR1 | WR2 | WR3 | TE | Flex | Flex Pos | DEF | Cumulative |
|---|---|---|---|---|---|---|---|---|---|---|---|
| 1 | 5.8% | 15.1% | 9.7% | 23.6% | 16.9% | 5.7% | 3.7% | 2.2% | WR | 35.5% | 118.2% |
| 2 | 3.3% | 15.8% | 9.5% | 11.7% | 11.0% | 6.1% | 5.0% | 8.4% | RB | 9.8% | 80.6% |
| 3 | 3.7% | 20.4% | 16.2% | 22.8% | 20.6% | 15.7% | 9.3% | 11.0% | WR | 12.3% | 132.0% |
| 4 | 6.1% | 24.4% | 3.3% | 29.3% | 12.6% | 6.7% | 14.7% | 0.3% | WR | 6.2% | 103.6% |
| 5 | 6.2% | 44.6% | 31.2% | 20.0% | 15.8% | 4.3% | 5.6% | 31.1% | RB | 8.5% | 167.3% |
| 6 | 4.2% | 54.8% | 18.9% | 19.7% | 10.8% | 4.6% | 9.3% | 1.3% | WR | 3.4% | 127.0% |
| 7 | 11.6% | 15.5% | 10.3% | 12.4% | 4.4% | 2.3% | 19.8% | 17.9% | TE | 12.8% | 107.0% |
| 8 | 6.4% | 45.1% | 29.7% | 27.1% | 7.8% | 5.4% | 19.5% | 0.9% | WR | 8.6% | 150.5% |
| 9 | 6.9% | 17.7% | 15.7% | 34.9% | 6.8% | 3.7% | 5.7% | 10.1% | RB | 11.5% | 113.0% |
| 10 | 7.6% | 21.4% | 13.7% | 12.9% | 8.0% | 1.6% | 19.6% | 6.1% | TE | 11.8% | 102.7% |
| 11 | 14.5% | 41.8% | 28.9% | 34.5% | 24.2% | 17.8% | 9.0% | 1.5% | WR | 9.2% | 181.4% |
| 12 | 15.0% | 18.4% | 15.8% | 16.4% | 13.8% | 5.0% | 2.9% | 14.5% | RB | 1.0% | 102.8% |
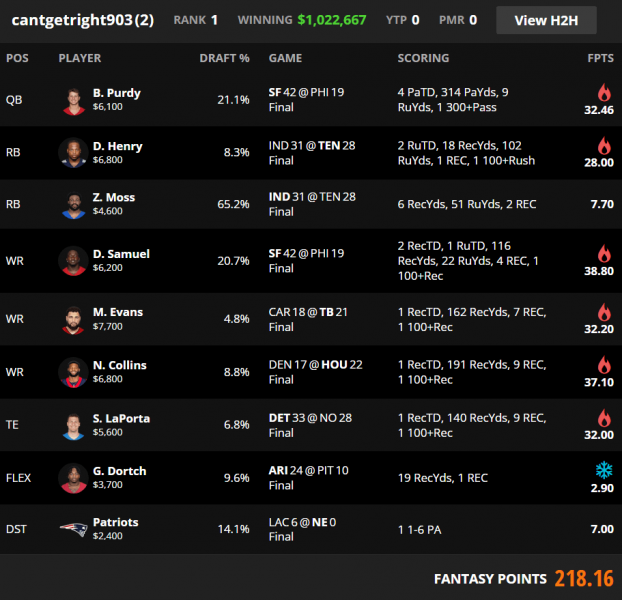
| 13 | 21.1% | 65.2% | 8.3% | 20.7% | 9.6% | 8.8% | 6.8% | 4.8% | WR | 14.1% | 159.4% |
| AVG | 8.6% | 30.8% | 16.2% | 22.0% | 12.5% | 6.7% | 10.1% | 8.5% | 11.1% | 126.6% | |
| 2022 AVG | 9.7% | 22.2% | 11.2% | 20.3% | 12.6% | 8.3% | 8.5% | 6.1% | 9.9% | 108.7% | |
| 2021 AVG | 7.6% | 19.7% | 9.5% | 17.8% | 11.8% | 7.6% | 10.0% | 4.4% | 7.1% | 95.3% | |
| 2020 AVG | 9.1% | 24.0% | 9.8% | 18.0% | 13.5% | 8.7% | 8.8% | 4.2% | 10.9% | 106.9% | |
| 2019 AVG | 7.8% | 26.7% | 14.5% | 19.7% | 10.3% | 6.6% | 12.6% | 7.9% | 11.1% | 117.4% |
Stacks
| Week | Primary Stack | Secondary Stack | Third Stack | Correlated Players |
|---|---|---|---|---|
| 1 | QB/WR/Opp RB | 3 | ||
| 2 | QB/RB/TE | RB/DEF | RB/Opp WR | 7 |
| 3 | QB/TE | RB/WR | 4 | |
| 4 | QB/WR | RB/Opp WR | WR/Opp TE | 6 |
| 5 | QB/WR | RB/DEF | RB/Opp WR | 6 |
| 6 | QB/WR/TE | RB/WR | 5 | |
| 7 | QB/TE | RB/Opp TE | 4 | |
| 8 | QB/WR/WR | 3 | ||
| 9 | QB/WR/WR/TE/Opp RB | 5 | ||
| 10 | QB/WR/WR | TE/DEF | 5 | |
| 11 | RB/WR | WR/TE | 4 | |
| 12 | WR/Opp WR | 2 | ||
| 13 | QB/WR | RB/Opp RB | 4 |
Flex
Teams that rostered four wide receivers made up 53% of lineups that finished in the top 1% while the field flexed a wide receiver 44% of the time. Top-1% lineups used three running backs in 29% of lineups, compared to 40% for the field.
Leverage/Unique Builds
Playing two running backs in the same game doesn’t often result in a Millionaire winner, but playing Derrick Henry with Zack Moss added unique correlation to the most popular player on the slate.
Rachaad White was another chalky (30% ownership) and Mike Evans offered direct leverage off of his teammate.
Most teams saved as much as possible at tight end with $2,500 Brevin Jordan on 25% of rosters. Paying up for a tight end like Sam LaPorta helped flip the build and create a more balanced lineup around Moss while most Moss teams paid up for players such as Tyreek Hill or Christian McCaffrey.

FanDuel Week 13 Sunday Million Winning Lineup
Ownership
| Week | QB | RB1 | RB2 | WR1 | WR2 | WR3 | TE | Flex | Flex Pos | DEF | Cumulative |
|---|---|---|---|---|---|---|---|---|---|---|---|
| 1 | 4.3% | 20.2% | 14.9% | 23.3% | 20.0% | 4.0% | 10.9% | 0.6% | WR | 1.2% | 99.4% |
| 2 | 2.2% | 13.1% | 10.8% | 11.3% | 10.7% | 7.1% | 6.4% | 3.3% | RB | 30.5% | 95.4% |
| 3 | 26.4% | 29.7% | 17.4% | 10.7% | 8.7% | 8.2% | 14.0% | 13.6% | RB | 4.1% | 132.8% |
| 4 | 10.0% | 27.1% | 4.2% | 10.3% | 8.0% | 1.2% | 5.4% | 2.2% | RB | 5.5% | 73.9% |
| 5 | 6.7% | 29.8% | 14.5% | 13.9% | 12.3% | 10.3% | 26.7% | 6.7% | TE | 8.7% | 129.6% |
| 6 | 11.3% | 28.8% | 20.6% | 25.6% | 11.7% | 9.4% | 2.6% | 14.7% | RB | 10.1% | 134.8% |
| 7 | 13.8% | 29.8% | 18.0% | 12.2% | 6.2% | 4.0% | 22.8% | 7.8% | RB | 4.4% | 119.0% |
| 8 | 6.3% | 18.7% | 9.4% | 17.3% | 8.6% | 7.1% | 16.0% | 4.7% | RB | 3.4% | 91.5% |
| 9 | 7.0% | 25.7% | 6.2% | 22.3% | 17.3% | 15.7% | 7.5% | 9.0% | WR | 20.6% | 131.3% |
| 10 | 9.6% | 15.5% | 12.2% | 15.5% | 7.9% | 2.2% | 1.7% | 9.7% | RB | 3.0% | 77.3% |
| 11 | 10.4% | 38.2% | 30.4% | 29.6% | 19.3% | 10.3% | 5.5% | 0.7% | WR | 7.9% | 152.3% |
| 12 | 28.3% | 36.9% | 9.4% | 23.6% | 12.0% | 8.9% | 11.1% | 4.9% | RB | 13.2% | 148.3% |
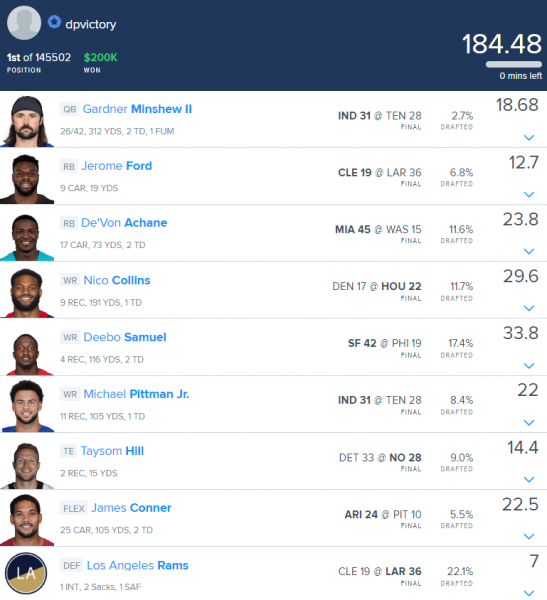
| 13 | 2.7% | 11.6% | 6.8% | 17.4% | 11.7% | 8.4% | 9.0% | 5.5% | RB | 22.1% | 95.2% |
| AVG | 10.7% | 25.0% | 13.4% | 17.9% | 11.9% | 7.4% | 10.7% | 6.4% | 10.4% | 113.9% | |
| 2022 AVG | 11.1% | 25.0% | 13.3% | 24.4% | 13.9% | 8.4% | 10.3% | 6.0% | 6.9% | 119.3% | |
| 2021 AVG | 9.6% | 25.1% | 12.7% | 18.0% | 11.0% | 6.3% | 10.0% | 6.3% | 7.5% | 106.5% | |
| 2020 AVG | 10.1% | 22.5% | 13.3% | 21.4% | 13.0% | 8.9% | 14.2% | 7.0% | 7.8% | 118.1% | |
| 2019 AVG | 9.8% | 28.7% | 11.2% | 18.7% | 12.3% | 7.7% | 10.7% | 5.8% | 7.7% | 112.5% |
Stacks
| Week | Primary Stack | Secondary Stack | Third Stack | Fourth Stack | Correlated Players |
|---|---|---|---|---|---|
| 1 | 0 | ||||
| 2 | QB/TE | RB/DEF | 4 | ||
| 3 | QB/Opp WR | RB/Opp WR | RB/Opp WR | 6 | |
| 4 | QB/WR/TE | RB/Opp WR | 5 | ||
| 5 | QB/WR | RB/DEF | WR/Opp TE | WR/Opp TE | 8 |
| 6 | QB/RB/Opp RB/Opp WR | RB/Opp WR | 6 | ||
| 7 | QB/Opp RB/Opp WR | RB/DEF | WR/Opp TE | 7 | |
| 8 | QB/WR | RB/DEF | 4 | ||
| 9 | QB/WR/WR/TE/Opp RB | WR/DEF | 7 | ||
| 10 | QB/WR/WR | RB/DEF | 5 | ||
| 11 | QB/WR/TE | RB/DEF | RB/WR | 7 | |
| 12 | QB/WR/Opp TE | RB/Opp WR | 5 | ||
| 13 | QB/WR | 2 |
Leverage/Unique Builds
Zack Moss was in 66% of Sunday Million lineups, making the Colts' passing game obvious leverage off of the highest-rostered player on the slate.
Jerome Ford and James Conner were both salary pivots off of Javonte Williams ($6,600) and Jaylen Warren ($6,500), who both projected for over 20% ownership.


