Week 12 DraftKings & FanDuel Winning GPP Lineup Review

In this space each week, I will review the winning lineups from the DraftKings Millionaire Maker and the FanDuel Sunday Million. Analyzing top lineups can help to tease out lineup-building strategies and offer clues on how you could have landed on a similar team.

DraftKings Week 12 Millionaire Winning Lineup
Ownership
| Week | QB | RB1 | RB2 | WR1 | WR2 | WR3 | TE | Flex | Flex Pos | DEF | Cumulative |
|---|---|---|---|---|---|---|---|---|---|---|---|
| 1 | 5.8% | 15.1% | 9.7% | 23.6% | 16.9% | 5.7% | 3.7% | 2.2% | WR | 35.5% | 118.2% |
| 2 | 3.3% | 15.8% | 9.5% | 11.7% | 11.0% | 6.1% | 5.0% | 8.4% | RB | 9.8% | 80.6% |
| 3 | 3.7% | 20.4% | 16.2% | 22.8% | 20.6% | 15.7% | 9.3% | 11.0% | WR | 12.3% | 132.0% |
| 4 | 6.1% | 24.4% | 3.3% | 29.3% | 12.6% | 6.7% | 14.7% | 0.3% | WR | 6.2% | 103.6% |
| 5 | 6.2% | 44.6% | 31.2% | 20.0% | 15.8% | 4.3% | 5.6% | 31.1% | RB | 8.5% | 167.3% |
| 6 | 4.2% | 54.8% | 18.9% | 19.7% | 10.8% | 4.6% | 9.3% | 1.3% | WR | 3.4% | 127.0% |
| 7 | 11.6% | 15.5% | 10.3% | 12.4% | 4.4% | 2.3% | 19.8% | 17.9% | TE | 12.8% | 107.0% |
| 8 | 6.4% | 45.1% | 29.7% | 27.1% | 7.8% | 5.4% | 19.5% | 0.9% | WR | 8.6% | 150.5% |
| 9 | 6.9% | 17.7% | 15.7% | 34.9% | 6.8% | 3.7% | 5.7% | 10.1% | RB | 11.5% | 113.0% |
| 10 | 7.6% | 21.4% | 13.7% | 12.9% | 8.0% | 1.6% | 19.6% | 6.1% | TE | 11.8% | 102.7% |
| 11 | 14.5% | 41.8% | 28.9% | 34.5% | 24.2% | 17.8% | 9.0% | 1.5% | WR | 9.2% | 181.4% |
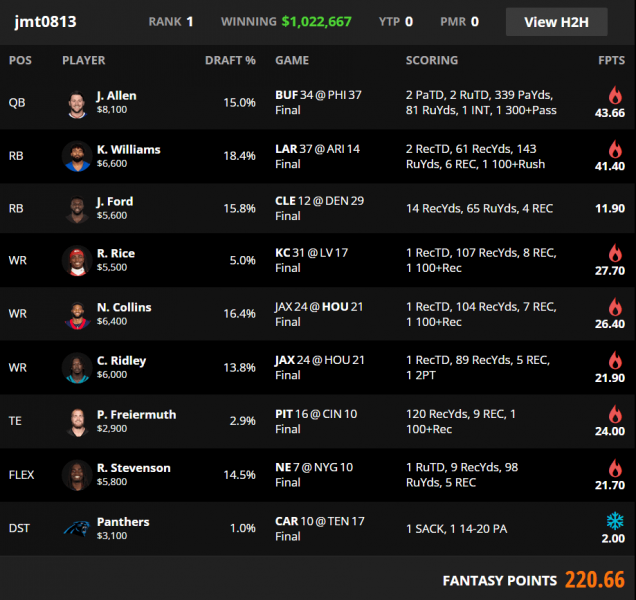
| 12 | 15.0% | 18.4% | 15.8% | 16.4% | 13.8% | 5.0% | 2.9% | 14.5% | RB | 1.0% | 102.8% |
| AVG | 7.6% | 27.9% | 16.9% | 22.1% | 12.7% | 6.6% | 10.3% | 8.8% | 10.9% | 123.8% | |
| 2022 AVG | 9.7% | 22.2% | 11.2% | 20.3% | 12.6% | 8.3% | 8.5% | 6.1% | 9.9% | 108.7% | |
| 2021 AVG | 7.6% | 19.7% | 9.5% | 17.8% | 11.8% | 7.6% | 10.0% | 4.4% | 7.1% | 95.3% | |
| 2020 AVG | 9.1% | 24.0% | 9.8% | 18.0% | 13.5% | 8.7% | 8.8% | 4.2% | 10.9% | 106.9% | |
| 2019 AVG | 7.8% | 26.7% | 14.5% | 19.7% | 10.3% | 6.6% | 12.6% | 7.9% | 11.1% | 117.4% |
Stacks
| Week | Primary Stack | Secondary Stack | Third Stack | Correlated Players |
|---|---|---|---|---|
| 1 | QB/WR/Opp RB | 3 | ||
| 2 | QB/RB/TE | RB/DEF | RB/Opp WR | 7 |
| 3 | QB/TE | RB/WR | 4 | |
| 4 | QB/WR | RB/Opp WR | WR/Opp TE | 6 |
| 5 | QB/WR | RB/DEF | RB/Opp WR | 6 |
| 6 | QB/WR/TE | RB/WR | 5 | |
| 7 | QB/TE | RB/Opp TE | 4 | |
| 8 | QB/WR/WR | 3 | ||
| 9 | QB/WR/WR/TE/Opp RB | 5 | ||
| 10 | QB/WR/WR | TE/DEF | 5 | |
| 11 | RB/WR | WR/TE | 4 | |
| 12 | WR/Opp WR | 2 |
This was the second time in as many weeks that the Millionaire winner used an unstacked quarterback. Only two winners from 2020–2022 used a “naked” quarterback roster. Week 12’s winner was the second Millionaire winner since the start of 2020 to have only two correlated players.
Flex
The field used three tight ends at a much higher rate than top-1% lineups (22%–13%). Top-1% lineups flexed running backs in 33% of lineups and wide receivers in 54%, compared to 29% and 48% for the field.
Leverage/Unique Builds
While this lineup was quite chalky on a player-by-player level, it was a unique build in that it used an unstacked quarterback and had little correlation throughout.
Rashee Rice offered leverage off of his teammates Isiah Pacheco and Justin Watson, who were both in over 13% of lineups.
Pat Freiermuth was a pivot from his teammate Jaylen Warren, who was in 23% of lineups and led to a contrarian roster construction in a week where no tight end below $4,100 carried double-digit ownership.

FanDuel Week 12 Sunday Million Winning Lineup
Ownership
| Week | QB | RB1 | RB2 | WR1 | WR2 | WR3 | TE | Flex | Flex Pos | DEF | Cumulative |
|---|---|---|---|---|---|---|---|---|---|---|---|
| 1 | 4.3% | 20.2% | 14.9% | 23.3% | 20.0% | 4.0% | 10.9% | 0.6% | WR | 1.2% | 99.4% |
| 2 | 2.2% | 13.1% | 10.8% | 11.3% | 10.7% | 7.1% | 6.4% | 3.3% | RB | 30.5% | 95.4% |
| 3 | 26.4% | 29.7% | 17.4% | 10.7% | 8.7% | 8.2% | 14.0% | 13.6% | RB | 4.1% | 132.8% |
| 4 | 10.0% | 27.1% | 4.2% | 10.3% | 8.0% | 1.2% | 5.4% | 2.2% | RB | 5.5% | 73.9% |
| 5 | 6.7% | 29.8% | 14.5% | 13.9% | 12.3% | 10.3% | 26.7% | 6.7% | TE | 8.7% | 129.6% |
| 6 | 11.3% | 28.8% | 20.6% | 25.6% | 11.7% | 9.4% | 2.6% | 14.7% | RB | 10.1% | 134.8% |
| 7 | 13.8% | 29.8% | 18.0% | 12.2% | 6.2% | 4.0% | 22.8% | 7.8% | RB | 4.4% | 119.0% |
| 8 | 6.3% | 18.7% | 9.4% | 17.3% | 8.6% | 7.1% | 16.0% | 4.7% | RB | 3.4% | 91.5% |
| 9 | 7.0% | 25.7% | 6.2% | 22.3% | 17.3% | 15.7% | 7.5% | 9.0% | WR | 20.6% | 131.3% |
| 10 | 9.6% | 15.5% | 12.2% | 15.5% | 7.9% | 2.2% | 1.7% | 9.7% | RB | 3.0% | 77.3% |
| 11 | 10.4% | 38.2% | 30.4% | 29.6% | 19.3% | 10.3% | 5.5% | 0.7% | WR | 7.9% | 152.3% |
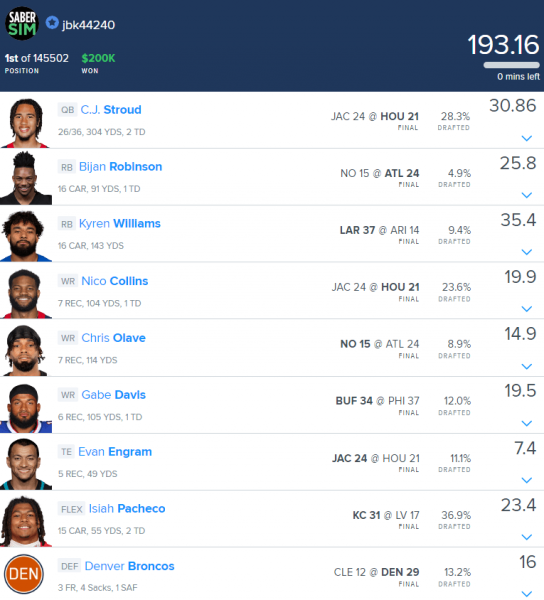
| 12 | 28.3% | 36.9% | 9.4% | 23.6% | 12.0% | 8.9% | 11.1% | 4.9% | RB | 13.2% | 148.3% |
| AVG | 11.4% | 26.1% | 14.0% | 18.0% | 11.9% | 7.4% | 10.9% | 6.5% | 9.4% | 115.5% | |
| 2022 AVG | 9.7% | 26.0% | 12.6% | 18.7% | 12.9% | 7.9% | 12.1% | 6.3% | 6.9% | 113.2% | |
| 2021 AVG | 10.5% | 23.9% | 11.2% | 20.2% | 11.2% | 6.5% | 10.9% | 5.1% | 5.1% | 104.6% | |
| 2020 AVG | 8.5% | 25.0% | 13.9% | 20.9% | 11.2% | 7.5% | 8.7% | 6.6% | 8.3% | 110.7% | |
| 2019 AVG | 11.9% | 26.5% | 12.9% | 22.7% | 15.0% | 9.3% | 13.2% | 7.1% | 9.6% | 128.2% |
Stacks
| Week | Primary Stack | Secondary Stack | Third Stack | Fourth Stack | Correlated Players |
|---|---|---|---|---|---|
| 1 | 0 | ||||
| 2 | QB/TE | RB/DEF | 4 | ||
| 3 | QB/Opp WR | RB/Opp WR | RB/Opp WR | 6 | |
| 4 | QB/WR/TE | RB/Opp WR | 5 | ||
| 5 | QB/WR | RB/DEF | WR/Opp TE | WR/Opp TE | 8 |
| 6 | QB/RB/Opp RB/Opp WR | RB/Opp WR | 6 | ||
| 7 | QB/Opp RB/Opp WR | RB/DEF | WR/Opp TE | 7 | |
| 8 | QB/WR | RB/DEF | 4 | ||
| 9 | QB/WR/WR/TE/Opp RB | WR/DEF | 7 | ||
| 10 | QB/WR/WR | RB/DEF | 5 | ||
| 11 | QB/WR/TE | RB/DEF | RB/WR | 7 | |
| 12 | QB/WR/Opp TE | RB/Opp WR | 5 |
Leverage/Unique Builds
Bijan Robinson was one of the best price pivots of the slate, priced just $100 below Jonathan Taylor, who was in nearly a quarter of lineups. Pairing him with Chris Olave added to the uniqueness of this play since few DFS players were targeting that game.
Kyren Williams had one of the best matchups on the slate and was expected to return to his full workload but FanDuel priced him as a top-three running back on the slate, keeping his ownership in check. No running back priced at or above $8,000 was projected for double-digit ownership, leading to a somewhat contrarian build.


