Week 6 DraftKings & FanDuel Winning GPP Lineup Review

In this space each week, I will review the winning lineups from the DraftKings Millionaire Maker and the FanDuel Sunday Million. Analyzing top lineups can help to tease out lineup-building strategies and offer clues on how you could have landed on a similar team.
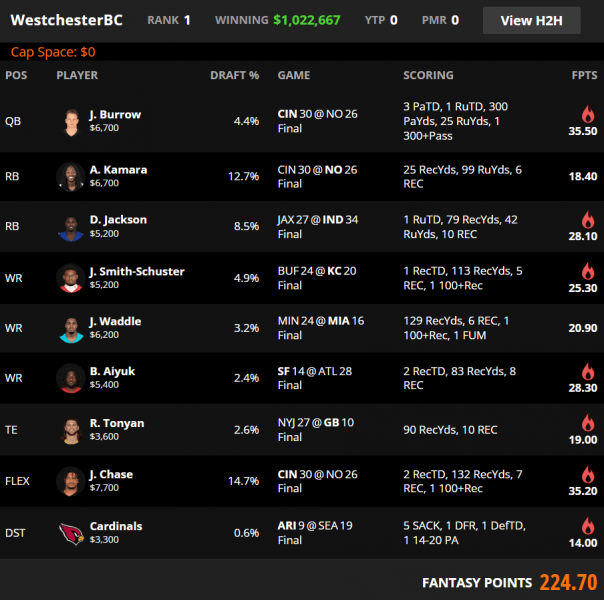
DraftKings Week 6 Millionaire Winning Lineup
Ownership
| Week | QB | RB1 | RB2 | WR1 | WR2 | WR3 | TE | Flex | Flex Pos | DEF | Cumulative | Average |
|---|---|---|---|---|---|---|---|---|---|---|---|---|
| 1 | 9.1% | 14.2% | 9.3% | 27.1% | 12.5% | 11.2% | 17.2% | 7.9% | WR | 3.0% | 111.5% | 12.4% |
| 2 | 3.6% | 10.4% | 8.4% | 21.3% | 19.7% | 14.4% | 9.2% | 6.3% | WR | 1.8% | 95.1% | 10.6% |
| 3 | 2.3% | 16.0% | 13.9% | 16.9% | 8.8% | 5.6% | 2.6% | 1.4% | WR | 15.7% | 83.2% | 9.2% |
| 4 | 6.8% | 38.0% | 15.2% | 15.4% | 11.4% | 5.7% | 19.8% | 6.1% | RB | 3.3% | 121.7% | 13.5% |
| 5 | 12.1% | 14.1% | 13.9% | 27.0% | 13.4% | 7.5% | 7.8% | 9.6% | RB | 22.7% | 128.1% | 14.2% |
| 6 | 4.4% | 12.7% | 8.5% | 14.7% | 4.9% | 3.2% | 2.6% | 2.4% | WR | 0.6% | 54.0% | 6.0% |
| AVG | 6.4% | 17.6% | 11.5% | 20.4% | 11.8% | 7.9% | 9.9% | 5.6% | 7.9% | 98.9% | 11.0% |
This week’s winning lineup had cumulative ownership of 54%, the second lowest of any Millionaire winner dating back to Week 1 of 2019.
The average cumulative ownership of winning Millionaire lineups this year is 98.9%. On average, winners have used five roster slots on players with sub-10% ownership, with four of those at sub-5%.
For the second time this season, the Millionaire winner did not have a player above 20% ownership.
Stacks
| Week | Primary Stack | Secondary Stack | Third Stack | Correlated Players |
|---|---|---|---|---|
| 1 | QB/TE | RB/Opp WR | WR/Opp WR | 6 |
| 2 | QB/WR/WR/Opp TE | 4 | ||
| 3 | QB/TE | RB/Opp WR | 4 | |
| 4 | QB/WR/WR/Opp RB/Opp WR/Opp TE | 6 | ||
| 5 | QB/WR | RB/WR/TE | WR/Opp WR | 7 |
| 6 | QB/WR/Opp RB | 3 |
With a QB/WR/Opp RB stack and no mini-correlations, the three correlated players in the lineup were the fewest by a Milly winner so far in 2022.
On average, winning lineups are using about five correlated players almost identical to the average of winners over the last two years.
Flex
The winning lineup flexed a wide receiver, but top-1% lineups flexed running back 44% and wide receiver 39% of the time. Those percentages were flipped for the field. This is the first time this season that the winner used a flex that went against the top 1% but also the closest gap we've seen between running back and wide receiver from the field.
Remember to start your latest-start, highest-salary player possible in the flex in order to maximize your late-swap options—this lineup got away with not doing that.
Leverage
Two running backs combined for 86% ownership with salaries of $6,000 and $4,600 while two other backs in the low-$5k range had ownerships above 17%. Using Deon Jackson as a salary-swivel proved to be arguably the best leverage play of the week.
Bill-Chiefs was guaranteed to carry a lot of ownership but pass-catchers on the Kansas City side not named Kelce were sure to be low-owned. Rostering JuJu Smith-Schuster played into the idea of getting exposure to that game but still being unique.
The Cardinals and Seahawks had the top two cumulative ownership projections on the slate. Playing Arizona’s defense was an easy way to leverage the entire game.
Tyler Lockett has the highest rostered rate on the slate and was one of two wide receivers rostered on more than 20% of lineups. Brandon Aiyuk was an almost perfect price pivot off of Lockett.

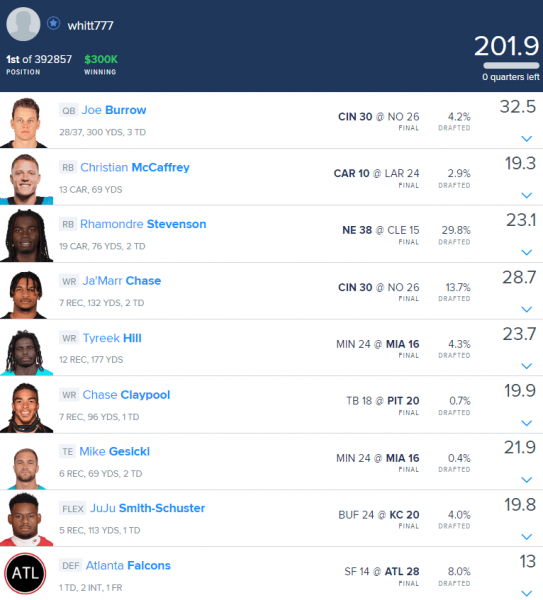
FanDuel Week 6 Sunday Million Winning Lineup
Ownership
| Week | QB | RB1 | RB2 | WR1 | WR2 | WR3 | TE | Flex | Flex Pos | DEF | Cumulative |
|---|---|---|---|---|---|---|---|---|---|---|---|
| 1 | 9.9% | 17.7% | 9.1% | 17.4% | 12.6% | 6.2% | 14.5% | 1.2% | RB | 2.8% | 91.4% |
| 2 | 3.0% | 7.9% | 2.8% | 9.9% | 6.4% | 5.9% | 8.7% | 0.5% | WR | 4.6% | 49.7% |
| 3 | 4.4% | 15.0% | 5.0% | 15.6% | 5.6% | 4.2% | 4.1% | 1.9% | RB | 6.6% | 62.4% |
| 4 | 2.2% | 31.2% | 12.8% | 11.7% | 7.6% | 7.6% | 20.1% | 3.9% | RB | 4.8% | 101.9% |
| 5 | 17.8% | 17.4% | 13.0% | 22.7% | 14.7% | 0.9% | 3.8% | 6.3% | RB | 4.6% | 101.2% |
| 6 | 4.2% | 29.8% | 2.9% | 13.7% | 4.3% | 4.0% | 0.4% | 0.7% | WR | 8.0% | 68.0% |
| AVG | 6.9% | 19.8% | 7.6% | 15.2% | 8.5% | 4.8% | 8.6% | 2.4% | 5.2% | 79.1% |
The Week 6 Sunday Million winning lineup had cumulative ownership of 68%, the third winner this year with cumulative ownership below 75%—from 2019–2021 there were only two such winners.
Average cumulative ownership for 2022 Sunday Million winners is 79.1% but over the last three seasons, that number is 118%.
Stacks
| Week | Primary Stack | Secondary Stack | Third Stack | Correlated Players |
|---|---|---|---|---|
| 1 | QB/TE | 2 | ||
| 2 | QB/WR/WR/Opp TE | RB/Opp WR | 6 | |
| 3 | QB/TE | RB/WR/DEF | RB/WR | 7 |
| 4 | QB/RB/WR/TE/Opp WR | RB/WR | 7 | |
| 5 | QB/WR/WR | RB/TE | 5 | |
| 6 | QB/WR | WR/TE | 4 |
In addition to a QB/WR stack, this lineup used a WR-TE mini-correlation. It's the fourth time this season that a Sunday Million winner has used a same-team, non-QB correlation.
Of the six Sunday Million winners this year, four have not used a bring-back with their QB stack. From 2020–2021, 32 of 35 Sunday Million winners used a QB stack—17 of them did not use a bring-back.
Leverage
The top four running backs in terms of ownership projection were priced at $7,500 or lower. Every tight end projected for double-digit ownership was $5,700 or more. By paying up for a running back and down for a tight end, this lineup flipped the assumed popular roster construction
Chris Godwin and Mike Evans both projected for double-digit ownership. Playing a low-owned wide receiver on the opposite side provided direct leverage off of those players.
Three of the top four wide receivers in terms of ownership projection were priced between $7,600 and $8,900. Tyreek Hill served as a salary-swivel in the high-end salary range.