Fanball Best Ball Strategy: Roster Construction

Best-ball roster construction is like a book. It tells a story with the players serving as the chapters. Their stories throughout the season all end with their total fantasy points, how they contributed to the full roster and where they finished in comparison to other players at the position. But construction itself is just one piece of the puzzle to being successful in best-ball.
I recently reviewed both strategy and high-level takeaways on roster construction specific to the FFPC. Scoring settings and deeper roster limits contextualized the analysis. Opportunity cost emphasized the importance of balance and reducing risk as the draft unfolded. But were the takeaways specific to the platform? Can the analysis only be applied to one site?
We took a similar quantitative look at the 20-round draft data provided by Fanball and asked the same basic questions that started us down this analytical rabbit hole:
- How were the winners constructing their winning teams?
- What investments were being made and how often?
- What can we take away from their process?
I started with roster construction and their win rates to find the actionable information we can take into the 2020 season.
Roster Construction Win Rates
| Rank | Win Rate | QB | RB | WR | TE | DEF |
|---|---|---|---|---|---|---|
| 1 | 11.60% | 2 | 6 | 7 | 3 | 2 |
| 2 | 10.10% | 2 | 6 | 8 | 2 | 2 |
| 3 | 7.10% | 3 | 6 | 7 | 2 | 2 |
| 4 | 6.30% | 3 | 5 | 7 | 3 | 2 |
| 5 | 5.90% | 2 | 6 | 7 | 2 | 3 |
| 6 | 5.50% | 2 | 5 | 8 | 3 | 2 |
| 7 | 5.50% | 3 | 6 | 6 | 3 | 2 |
| 8 | 5.50% | 2 | 5 | 7 | 3 | 3 |
| 9 | 5.30% | 2 | 7 | 7 | 2 | 2 |
| 10 | 4.00% | 2 | 5 | 8 | 2 | 3 |
| 11 | 3.20% | 3 | 5 | 7 | 2 | 3 |
| 12 | 2.80% | 3 | 5 | 8 | 2 | 2 |
A term that comes to mind when looking at these builds is ‘risk tolerant’. The core positions required balance and a nuanced approach to making the top 12. With roster requirements to start three WRs each week plus PPR scoring, draft capital naturally leaned towards the position. However, there wasn’t a complete imbalance or neglect of the other positions in order to secure more wide receivers. On the contrary, running backs typically held a slight advantage over wide receivers with approximately 12 being drafted in the first two rounds. But while the market likely dictated players and their value, multiple builds could be used to take down a league.
Another descriptor would be ‘diversity’. The comparatively shortened rosters allowed for a wider array of paths to victory. Investments in both QB and TE give us some insight. A 60-40 split exists between drafting two or three players at each position, with the majority on the former—a far cry from 83% of FFPC drafters drafting three QBs and 67% drafting four TEs. It’s here where opportunity cost can be leveraged as builds that drafted only two at either position were more likely to invest early in order to secure a top-ranked player at either position. With so much risk being accepted in this format, I investigated it further. Two builds stuck out:
- 2/6/8/2/2 - 10.1% win rate
- 2/7/7/2/2 - 5.3% win rate
The idea of taking two players at any single onesie position holds more logical value in shorter formats. With fewer rounds to draft, acquiring more players at the core positions (RB or WR) is a strategy unto itself. But to take two players at each onesie position assumes two things. First, that the two players make it through the season. Unless the one player sits atop their positional rankings, you’d need a combination of the two players consistently placing in the top 12 (or higher) to give you an edge. Player performance leads to the second assumption and details of how the rosters were leveraged.
Not only were two healthy players required but rostering a top-five player at their position was needed to optimize this build. For example, drafters using this build path were more likely to take an early tight-end with 22% drafting either Travis Kelce, George Kittle, or Zach Ertz. The top-five quarterbacks were drafted at the same rate across other builds, but the importance of drafting the correct quarterbacks (or drafting quarterbacks that landed in the top five at the end of the season) was still the critical component. And those two points bring us to our takeaway from these builds.
Takeaways
Consensus rankings and ADP leads us to draft players at value with some adjustments based on personal preference. But how the market values players isn't necessarily the strongest indicator of how players will finish by the end of the season. That doesn’t bode well for a strategy requiring you to hit within the top five at multiple positions. To detail this further, I looked back at ADPs for just quarterbacks and compared them to end-of-season rankings.
| 2015 | 2016 | 2017 | 2018 | 2019 | |
|---|---|---|---|---|---|
| Top-12 Finishes | 6 | 6 | 6 | 9 | 7 |
| Top-5 Finishes | 3 | 4 | 3 | 3 | 3 |
We’re not that bad at pinpointing quarterbacks who should finish in the top 12, but we need to crack the top five to have a competitive edge—often those top-five QBs have been drafted outside the top 12.. With players like Lamar Jackson and Patrick Mahomes exceeding their draft-day value, the prospect of hitting on one at a single position let alone across QB, TE, and DST appears daunting. In fact, we haven’t had a QB with a top-12 ADP finish as the overall QB1 since 2017. So while both builds using just two picks at each onesie position totaled a 15.4% win rate, the requirements for a top-five player adds a layer of difficulty.
The fact that nearly 45% of the top-12 QBs come from outside consensus top-12 rankings highlights our need to account for opportunity cost. While we draft in the hopes that players meet or exceed their value, their likely range of outcomes—including floors—must be considered along with their draft cost. Drafting either of the top two at quarterback or tight end would have required picks ranging from the middle of the first round (Travis Kelce – 6.5 ADP) to the early sixth round (Deshaun Watson – 65.6 ADP). With expected fantasy output for the core positions decreasing by round, investments at the onesie positions should always be approached with an understanding of what players you’re giving up at higher leverage positions in order to take a quarterback or tight end.
Early Rounds
With opportunity cost in mind, I looked at how the early rounds played out for winning teams in 2019. The decisions made here significantly impact later-round picks as expected fantasy output decreases each round. While we saw more balance in overall builds, I expected to find stances on RB and WR values taken here with the remainder of the draft to equalize their squads.
| % of Winning Teams | QB | RB | WR | TE |
|---|---|---|---|---|
| 24.67% | 0 | 3 | 3 | 0 |
| 19.45% | 0 | 3 | 2 | 1 |
| 19.22% | 0 | 2 | 3 | 1 |
| 9.22% | 0 | 2 | 4 | 0 |
| 8.21% | 0 | 4 | 2 | 0 |
| 3.71% | 0 | 1 | 4 | 1 |
| 2.55% | 0 | 4 | 1 | 1 |
| 1.81% | 1 | 3 | 2 | 0 |
| 1.78% | 0 | 2 | 2 | 2 |
| 1.60% | 1 | 2 | 3 | 0 |
| 1.51% | 1 | 2 | 2 | 1 |
| 1.30% | 0 | 1 | 5 | 0 |
Takeaways
Balance was (and is) the optimal approach. As much as vividness and recency bias may lead us to draft RBs early and often, the PPR format and expected production of an early-round pass-catcher couldn’t be ignored. Over 63% of the early-round builds favored this approach, but, as expected, the shortened roster format compared to FFPC still allowed for more extreme stances to be taken given the right players.
Examples of ‘overload builds’ are below:
| % of Winning Teams | QB | RB | WR | TE |
|---|---|---|---|---|
| 9.22% | 0 | 2 | 4 | 0 |
| 8.21% | 0 | 4 | 2 | 0 |
| 3.71% | 0 | 1 | 4 | 1 |
| 2.55% | 0 | 4 | 1 | 1 |
| 1.30% | 0 | 1 | 5 | 0 |
To load up on volume early, drafters will attempt to lean into a single position. Wide receiver makes sense given the scoring settings and roster requirements, but results don’t heavily support the build path. The same goes for running backs. In fact, overloading on running backs early was less profitable than applying the same approach to wide receivers. So while the early rounds may have more RBs drafted, observing a balanced approach at the core positions is the optimal path.
What’s also captured is the denial of ‘cornering the market’ early on the tight-end position. Note how only a single investment at the TE position was significantly more profitable than drafting two early. A common trend throughout the 2019 offseason was a ‘Kelce-Kittle’ or ‘Kittle-Ertz’ stack that would net the majority of TE targets across the position early but that strategy rarely turned into a winning roster.
The Bottom Line
Looking at roster construction gives us the big picture. Draft capital spent at each position gives us a general guide to apply during our drafts. At the very least it sets maximum limits—we don’t need to consider drafting five quarterbacks or eight running backs. The basic idea is given by the builds. We’re left to determine when and how often to invest at each position as the draft unfolds.
A balanced approach to the early rounds is critical to success. With shortened rosters, building sub-optimally in the first quarter of the draft isn’t the best recipe for success. I broke down opportunity cost between RB and WR to highlight this point.
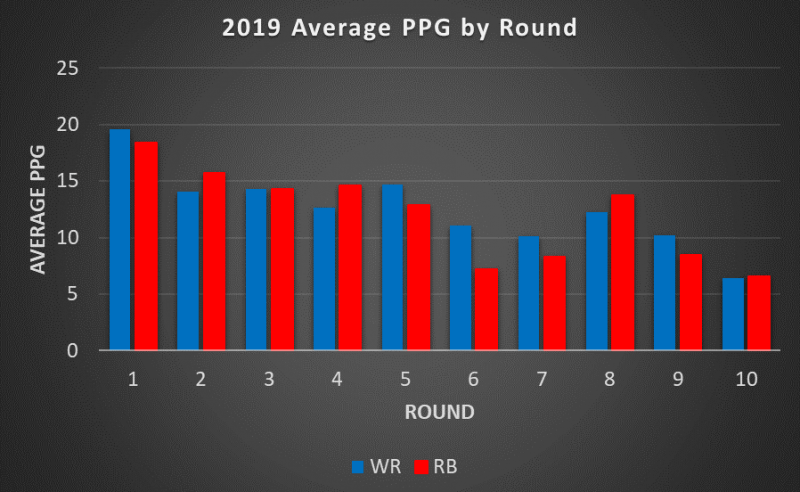
The fallacy in emphasizing a single position becomes clear. Both positions drop in average scoring at a similar rate. The optimal approach to building a successful roster blends the two using draft cost and projected outcomes. When accounting for both, we can secure stronger rosters that will be competitive in the coming season.