Analyzing Bust Rates of Early-Round Picks: Part One

The most important picks of your fantasy draft are obviously your earliest. The first two picks pave the landscape for your draft strategy and how you formulate the rest of your team. Many try to plan out these picks, asking themselves if they should go with some permutation of RB/WR, WR/RB etc. Others argue that these picks should be very risk-averse, as you don’t want to waste your early draft capital on players who could potentially bust. Fantasy owners annually pass on guys out of the fear of him busting. We are seeing that now with Todd Gurley as his ADP continues to slip out of the fear of him underperforming in 2019. But what categorizes a bust and which position busts more, a running back or a wide receiver?
Running Backs vs. Wide Receivers
To tackle this, I will be analyzing bust rates in both running backs and wide receivers over the past five years. Depending on league size and how the draft goes, it is difficult to evaluate how many of each position are taken during the first two rounds. So to be fair, I will simply look at the top-15 running backs and wide receivers. I chose 15 since it encapsulates the general RB1/WR1 tier. There's also a chance most leagues don't draft 12 running backs and 12 wide receivers during the first two rounds. This way, opening up the threshold to 15 allows for more combinations of selections of what could happen in the first two rounds. I will be using their ADP position rank for pre-draft rank (obtained from fantasy football calculator), and their PPR finishing rank to determine if the player busted or not.
These bust rates change based on your definition of a bust. Is it a player who doesn’t live up to their draft capital, finishing as an RB2 after being drafted as an RB1? Or is it someone who just completely falls off the deep end and finishing tens of ranks below their pre-draft rank. I analyzed bust rates in three thresholds, finishing 6, 12, and 24 ranks below their pre-draft rank. In other words, players drafted at the upper end of their position rank and finished at the low end, players finishing a whole position rank below their pre-season rank, and players finishing a whole two positions below their pre-draft rank.
Bust Rate Thresholds
For those who have a zero-tolerance for draft picks faltering in the first two rounds, below shows the bust rates for running backs and wide receivers over the years.
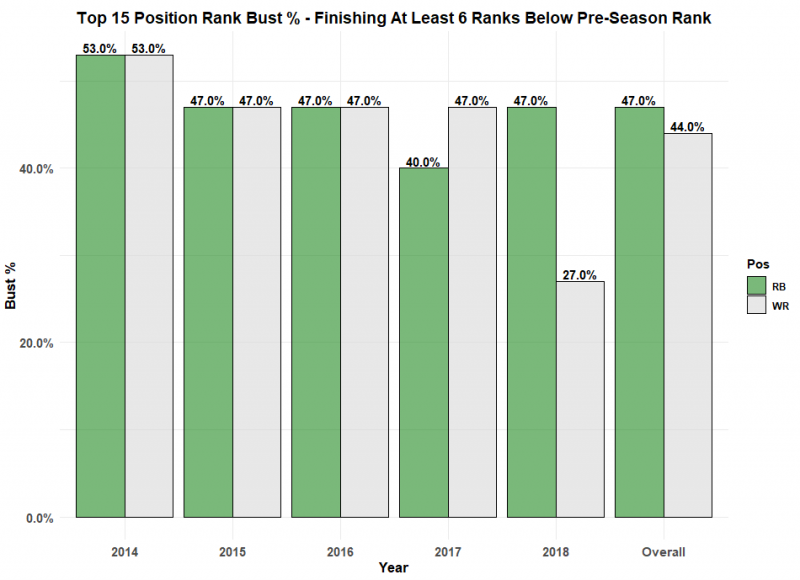
As you can see its pretty even overall with each position rank underperforming about half the time. This makes sense since six position ranks is a very small threshold. Instead, let's look at players who finished an entire tier below their preseason ADP (12 spots).
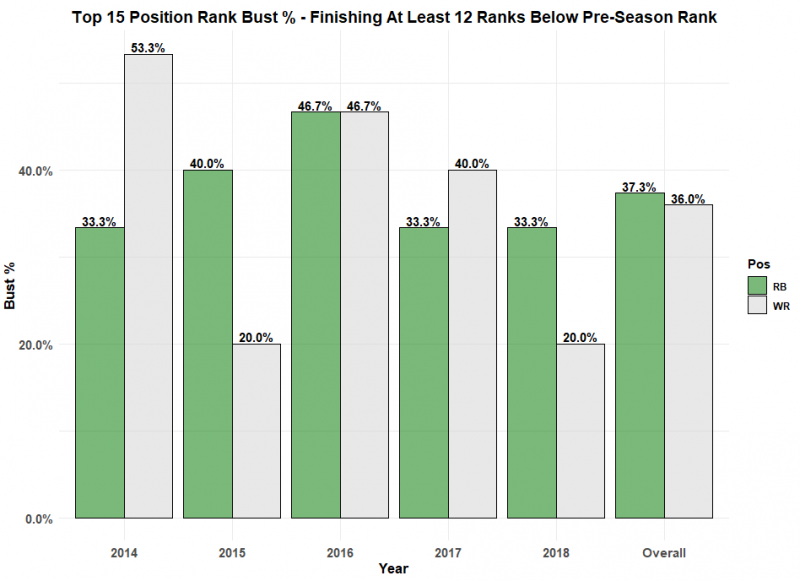
Now when defining a bust as a whole position rank below pre-draft rank, running backs and wide receivers still seem pretty even. This makes sense for both sides—I would hypothesize that running back injury rates are higher than receivers as they are involved in more plays generating more wear and tear on their body. Meanwhile, the wide receiver position ranks are a lot more dense and competitive. For example, only about 70 PPR points separated the WR1 & WR12 last year compared to the 150 PPR points for the RB1 & RB12.
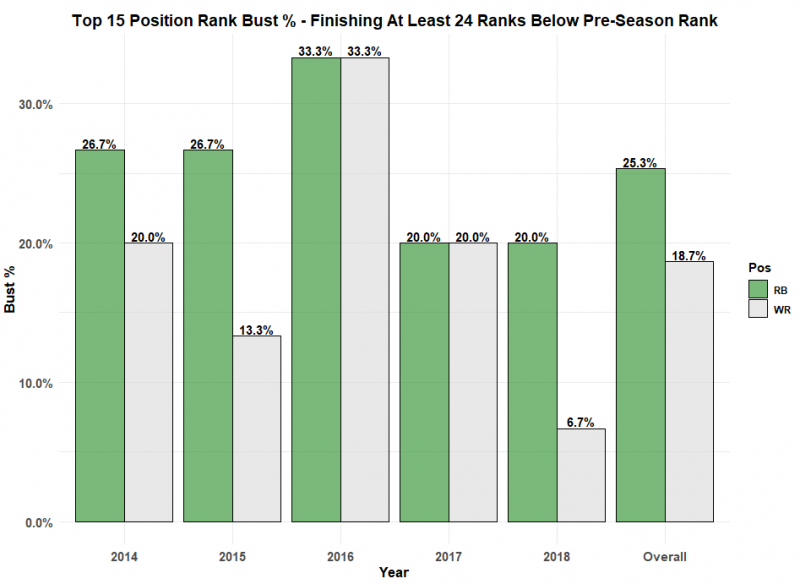
Finally, for absolute busts finishing a whole two tiers below their pre-draft rank, it seems like wide receivers have a slight edge in being less risky. This shows the volatility in first- and second-round running backs as about a quarter of top-12 totally bust every year. And once again since wide receiver is a more dense position, this makes their bust rate even more impressive.
Putting This To Use On Draft Day
It is crucial to hit on your first couple of picks in fantasy drafts and in order to do so, you may want to avoid as much risk as possible. Generally, the first two rounds are filled with running backs and wider receivers, each coming with their own value and risk. As a group, top-tier wide receivers are total busts less often than running backs. This makes sense since running backs are more injury prone as well as the fact that their production is very difficult to predict year to year—specifically running back opportunity based on things like game script and especially efficiency. Efficiency, or yards per carry, is also difficult to predict since it is greatly influenced by offensive line performance. Meanwhile, wide receiver metrics like target share and average depth of target (aDOT) are more stable year to year. More often than not, if you have a high pick in the draft you should pick the best running back available. However once the draft gets going, the safety of a wide receiver seems more and more valuable.
While this analysis gives us a good starting point on a macro level, part two of this series will look at bust rates on a more micro level to see if there is any deviation from these results based on exactly how early a position is taken.