DraftKings Week 13 GPP Breakdown

Week 12 Millionaire Maker winner keasy took down the grand prize with a strong showing from a Russell Wilson-to-Doug Baldwin stack (more on that in a moment).
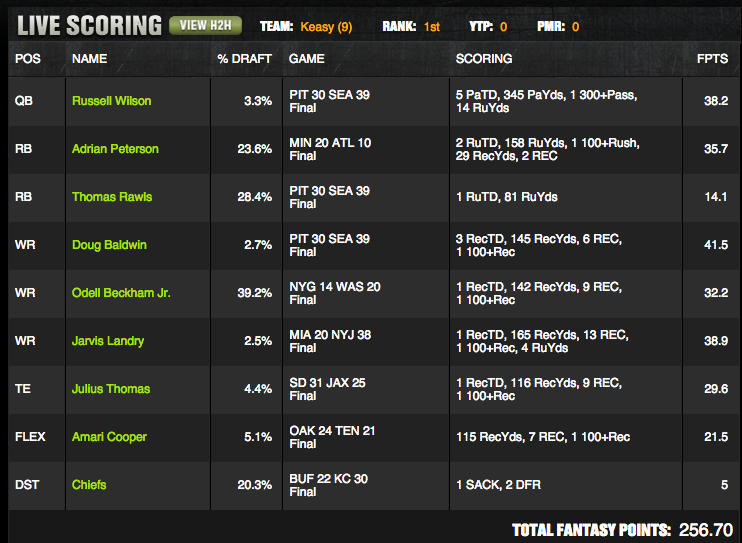
Well the five plays owned 5.1% or less surely stands out, perhaps more important was keasy wasn't scared to pair QB Wilson and WR Baldwin with negatively-correlated chalk RB Thomas Rawls. Rawls's mediocre 14.1 points didn't help keasy out much, but because Rawls was a 28.4% owned chalk play, it kept Wilson's and Baldwin's ownership levels depressed, and keasy took advantage of the differentiation that could be obtained by rostering them. Of late, I've continuously talked up the theory that entrants hopeful of winning the grand prize in large GPPs need to put aside their hesitation to pair players with largely irrelevant negative correlations, and keasy's winning lineup further validates that viewpoint.
Selecting a pool of players to target in GPPs is only half the battle; you also have to put them all together. With that in mind, I’ve revamped the format of this column. With an eye toward lineup construction, I’ve grouped players to target by lineup slot.
I’ve also created a “profile” for each position and lineup slot. This specifies the salary range and ownership level that will generally give you the best odds. These profiles reflect data I have compiled from each of the 12 lineups of this year’s Millionaire Maker, DraftKings’ largest GPP. You will see the information reflected in the profiles, but I want to point out some important trends from the winning lineups before we get into the plays.
- Go contrarian at QB: QBs in winning lineups have an average ownership of 6.6%, the lowest of any position group by far.
- Pay up at WR: On average, the most expensive WR in a winning lineup costs $8,200 and the second-most-expensive WR costs $6,900. No other lineup slot has an average of over $6,200.
- One chalk play at RB, WR is OK: The average highest-owned RB in a winning lineup was owned 29%. The average highest-owned WR was owned 31%. Those represent huge drop-offs from the other RBs (13% including flex) and WRs (12% including flex).
- RB has been the best flex option: RBs were in the flex spot of the winning lineups 66.6% of the time, WRs 33.3%, TEs 0%.
- Salary Allocation: The average salary allocation per lineup slot, from highest to lowest is WR1, WR2, RB1, QB, TE, RB2, WR3, FLEX, DST
- Make the chalk work for you; also know where to go contrarian: The average ownership per lineup slot, from highest to lowest is WR1, RB1, WR2, D, RB2, TE, WR3, QB, FLEX.
When a player is listed under a heading with multiple lineup slots, i.e. "WR 1/2", it means that player can be used to fill either slot.
I also list the (projected) chalk plays -- defined as the highest owned player at a position or any player projected to push 20% owned -- at each slot, gleaned from my Tournament Ownership Outlook column. For every position except QB, listed chalk plays are still recommended plays unless otherwise noted. However, you should generally limit yourself to one chalk play apiece at RB and WR and generally not have more than three chalk plays total in a lineup.
My hope is that casual readers will now have more direction as far as how to actually construct a winning GPP lineup, rather than just identify players to target. On the other hand, more advanced readers who prefer to do further independent research can still use the profiles as a lineup construction template even if they do not agree with some of the listed plays.
A note on pairing the players from the same team/game: In general, players from opposing passing games should be paired up whenever possible. Obviously, QBs and WRs should be stacked whenever possible, as should RBs and defenses. QBs and RBs on the same team have a slightly positive correlation and should not be avoided. RB and WR has a slight negative correlation, but it's so small that the pairing should not be avoided either.
Editor's Note: 4for4 has an ALL-NEW DFS SUBSCRIPTION! It includes our revolutionary Lineup Generator, Stack Value Reports, Ceiling & Floor Projections, GPP-Specific Articles, Ownership Outlooks, DFS Theory Articles, Lineup Construction Articles, a Downloadable .csv with Projections and Salary Data, and much more! DETAILS HERE! Previous subscribers don't worry, you'll get the same DFS content you got last season, but we think you'll want to UPGRADE to our DFS subscription because it takes our DFS content to the next level!
Quarterback
QB Profile: Median salary $6,000, average ownership 7%. QBs are generally under $7,000 and under 10% owned.
Chalk (You generally want little or no exposure to chalk at QB): Cam Newton, Ben Roethlisberger
Jay Cutler $5,100 vs. SF - He has accounted for 65% of Bears offensive TDs and their Vegas implied total (25.3) is 4.3 points higher than their season average of points scored. The 49ers rank 22nd in QB aFPA and have allowed 9.5 yards per attempt, a 72% completion rate, and a 12:2 TD-to-INT ratio on the road.

- DFS & Season-Long Content
- Lineup Generator
- Optimal Cash & GPP Lineups
- Floor & Ceiling Projections
- -Leverage Scores
- -...and much much more!


