Introducing the Best Ball Draft Curve

In real football, draft curves have been all the rage. They give us an idea of how valuable picks in the draft are so that we can evaluate draft pick trades as well as player selections. That said, the concept of draft curves has not yet proliferated to the fantasy football mainstream.
The notion of Value-Based Drafting has been around for a while now, but that is more of a forward-looking view on drafting that relies heavily on the accuracy of projections. The new Best Ball Draft Curve that I have formulated will help us evaluate how drafts, roster constructions, and teams perform in different ways while complementing our best ball analysis to focus on more than just advance rates and roster points.
This idea builds on Mike Leone's Best Ball Mania Manifesto and includes more data (BBM1 and BBM2 data) while also separating values by position.
In this article, I will give a high-level overview of what the draft curve is, how it should be interpreted, and some examples of how it can be used.
Methodology
Before I get to the fun stuff, let me quickly explain how I created these draft curves. Simply put, I took the replacement value of players drafted at each overall draft pick and averaged that value. So the first overall pick value is a combination of drafters taking Christian McCaffrey, Justin Jefferson, Jonathan Taylor, and more players, and fitting it into a model to create an expected draft value for that overall pick. The type of model I used for this is a Generalized Additive Model (GAM), which accounts for the non-linear trend of draft value by using a smoothing function for the data.
When I get to the positional draft curve, I repeated the same process but identified a player's position as another variable to capture that position's draft value at each draft pick. I should also note that this analysis uses data from BBM1, BBM2, and BBM3.
Best Ball Draft Curve
Below is the draft curve that includes all picks without a focus on positional value:
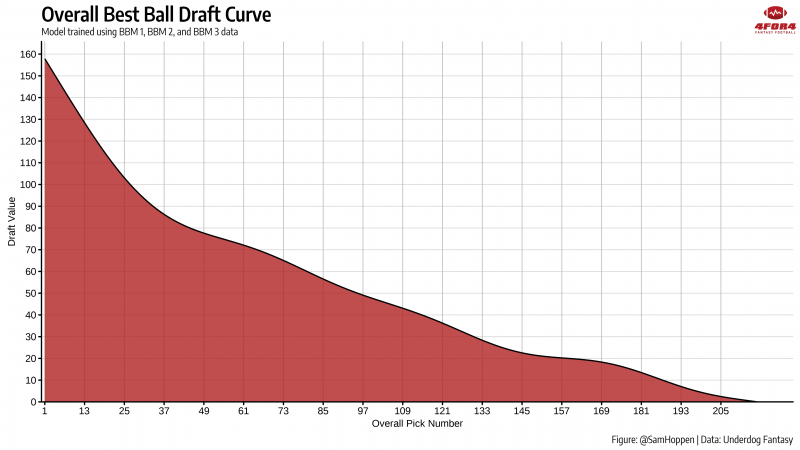
While this uses data from all three BBM tournaments so far, the number of observations from BBM3 (last year) is nearly three times the combined observations from BBM1 and BBM2 combined, so there's inherently some weighting towards BBM 3 results going on (you'll see this more in the next section).
The biggest trend to notice with this curve is the non-linear aspect of it—we see a rather steep decline in value through the first three rounds before it starts to even off a bit. It's not a novel finding that the first couple rounds of a draft are more important, but now we can better quantify how much more valuable they are.
One application of this draft curve that Leone used was measuring draft capital gained (or draft capital over expected). In a sense, if you draft a player with an ADP of 11 at pick 17, you gain about 12 points in draft capital (the 11th pick is worth about 132 points while the 17th pick is worth about 120 points). We will be exploring further analysis in this context and using this evaluation method in future articles.
As another high-level observation, here's a look at how much draft value each draft slot has:
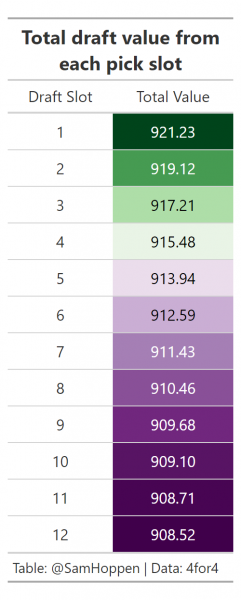
While it shouldn't come as a surprise that the first three picks have the most value based on the draft curve, it further reiterates that picking from the top of the draft gives you a slight edge. Obviously, you don't get the option to choose your draft slot in best ball drafts, but we will be doing more research on how to approach drafts from different draft slots.
Until then, let's get to the next step, which is to break out this draft curve by position for more guidance on positional value.
Positional Draft Curve
Below is the draft curve that includes all picks split out by position:
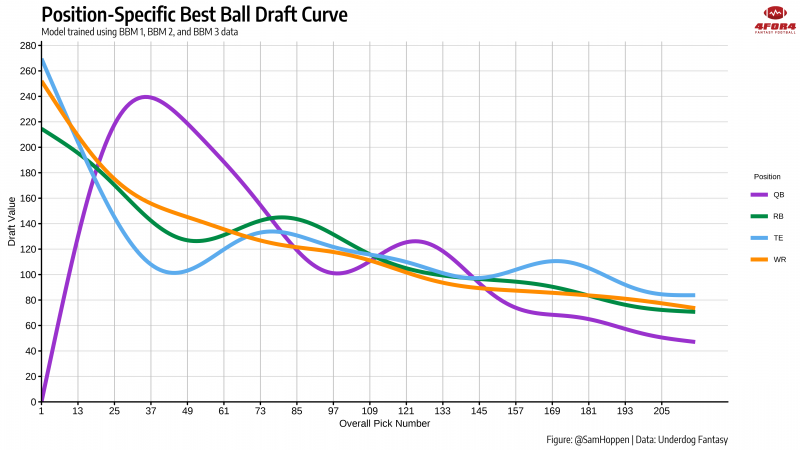
There are some high-level observations that we can dissect from this chart that are generally applicable to most drafts before I get into the applications this has to current BBM 4 drafting. Starting off with the quarterback position, there is a big emphasis on the elite quarterbacks. Specifically, landing one in rounds three through six has offered drafters a big edge.
Additionally, we can clearly see that the running back dead zone is real. There's a pretty substantial dip in value after the first round through the end of the fifth round. This concept has been discussed at length already but gives us another data point to suggest that avoiding the running back position in this range is the ideal move.
The wide receiver position is probably the most complex to interpret because there is only one small interval (around picks 12 through 20) where the draft curve implies taking a wide receiver is the optimal position to take. However, the wide receiver curve is also the flattest, without any major peaks or valleys in its value throughout the draft. This could be taken one of two ways: it's either never a bad idea to take a wide receiver or never a great idea to take a wide receiver. While that's probably a bit extreme, more exploration into wide receiver value needs to be done.
Finally, the elite tier of the tight end position is heavily skewed by Travis Kelce's dominance over the past several seasons. Teams who have invested in the elite tight ends have really only been rewarded if they drafted Kelce. Similar to the running back position, though, there appears to be a "dead zone" for tight ends in Rounds 3–6 where the value dips lower in Round 4 than it is in Round 15.
What Does This Mean for Best Ball Mania IV?

- All Premium Content
- The most Accurate Rankings Since 2010
- Expert Draft Picks w/DraftHero
- Highest Scoring Lineup + Top Available Players w/LeagueSync
- ...and much much more