Week 1 DraftKings & FanDuel Winning GPP Lineup Review

In this space each week, I will review the winning lineups from the DraftKings Millionaire Maker and the FanDuel Sunday Million. Analyzing top lineups can help to tease out lineup-building strategies and offer clues on how you could have landed on a similar team.
Two of the most important elements to understand when building GPP lineups are ownership and stacking so before jumping into Week 1 winning lineups, here’s a review of how 2021 winners build around these concepts.
Ownership and Stacks in 2021 Winning DraftKings Lineups
| Week | QB | RB1 | RB2 | WR1 | WR2 | WR3 | TE | Flex | Flex Pos | DEF | Cumulative | Average |
|---|---|---|---|---|---|---|---|---|---|---|---|---|
| 1 | 3.0% | 12.9% | 3.9% | 13.7% | 12.6% | 11.3% | 14.4% | 5.0% | WR | 1.3% | 78.1% | 8.7% |
| 2 | 13.4% | 7.0% | 4.8% | 20.3% | 8.6% | 4.7% | 17.8% | 2.4% | WR | 8.9% | 87.9% | 9.8% |
| 3 | 5.4% | 14.8% | 6.3% | 13.6% | 6.7% | 4.2% | 1.2% | 3.3% | WR | 16.8% | 72.3% | 8.0% |
| 4 | 6.8% | 20.2% | 6.7% | 17.7% | 10.1% | 9.9% | 9.6% | 2.5% | RB | 5.6% | 89.1% | 9.9% |
| 5 | 6.4% | 35.4% | 6.4% | 23.6% | 14.7% | 11.3% | 4.5% | 5.4% | WR | 8.1% | 115.8% | 12.9% |
| 6 | 1.7% | 25.1% | 15.0% | 5.6% | 5.3% | 0.8% | 21.9% | 2.7% | TE | 14.9% | 93.0% | 10.3% |
| 7 | 13.4% | 12.6% | 7.0% | 25.9% | 19.3% | 4.3% | 2.0% | 4.1% | WR | 2.8% | 91.4% | 10.2% |
| 8 | 8.0% | 11.0% | 6.0% | 26.4% | 24.6% | 14.6% | 4.5% | 14.5% | WR | 5.1% | 114.7% | 12.7% |
| 9 | 3.5% | 21.1% | 8.1% | 28.3% | 14.2% | 7.0% | 15.7% | 2.0% | RB | 3.0% | 102.9% | 11.4% |
| 10 | 9.7% | 48.4% | 26.2% | 10.4% | 8.5% | 8.0% | 4.0% | 3.3% | RB | 3.0% | 121.5% | 13.5% |
| 11 | 9.3% | 3.9% | 2.8% | 4.6% | 3.0% | 1.2% | 0.1% | 0.7% | RB | 2.4% | 28.0% | 3.1% |
| 12 | 3.5% | 14.2% | 11.8% | 8.5% | 6.4% | 3.4% | 36.4% | 3.6% | RB | 3.8% | 91.6% | 10.2% |
| 13 | 11.7% | 22.5% | 20.8% | 17.6% | 14.2% | 9.9% | 7.2% | 6.6% | TE | 5.8% | 116.3% | 12.9% |
| 14 | 9.6% | 13.3% | 2.3% | 14.0% | 10.7% | 9.7% | 7.2% | 1.6% | WR | 14.5% | 82.9% | 9.2% |
| 15 | 2.6% | 12.8% | 10.8% | 34.9% | 18.6% | 16.2% | 11.3% | 8.8% | WR | 3.7% | 119.7% | 13.3% |
| 16 | 12.4% | 44.6% | 7.1% | 13.8% | 9.3% | 8.3% | 8.7% | 4.0% | RB | 9.2% | 117.4% | 13.0% |
| 17 | 8.0% | 24.0% | 15.7% | 22.4% | 13.7% | 4.5% | 6.9% | 8.4% | RB | 11.0% | 114.6% | 12.7% |
| 18 | 7.8% | 10.3% | 9.3% | 18.3% | 11.6% | 6.9% | 6.4% | 0.2% | WR | 8.1% | 78.9% | 8.8% |
| AVG | 7.6% | 20.2% | 9.5% | 17.7% | 11.8% | 7.6% | 10.2% | 4.6% | 7.1% | 90.5% | 10.7% |
| Week | Primary Stack | Secondary Stack | Third Stack | Correlated Players |
|---|---|---|---|---|
| 1 | QB/WR/RB | WR/TE | 5 | |
| 2 | QB/RB/TE | RB/Opp WR | WR/DEF | 7 |
| 3 | QB/WR/WR/Opp TE | RB/WR/Opp WR | 7 | |
| 4 | QB/TE/Opp WR | 3 | ||
| 5 | QB/WR/WR | RB/DEF | 5 | |
| 6 | QB/WR | RB/DEF | 4 | |
| 7 | QB/WR/WR/Opp RB | WR/DEF | 6 | |
| 8 | QB/WR/Opp WR | 3 | ||
| 9 | QB/WR | RB/DEF | WR/TE | 6 |
| 10 | QB/WR | RB/Opp RB/Opp TE | 5 | |
| 11 | QB/TE/Opp WR | RB/DEF | 5 | |
| 12 | QB/RB/WR | RB/TE | WR/DEF/Opp WR | 8 |
| 13 | QB/TE | RB/DEF | RB/Opp WR | 6 |
| 14 | QB/WR | RB/DEF | 4 | |
| 15 | QB/TE/Opp WR | WR/Opp WR | WR/DEF | 7 |
| 16 | QB/RB/WR/WR/Opp TE | 5 | ||
| 17 | QB/WR/Opp RB | WR/Opp TE | 5 | |
| 18 | QB/WR/TE/Opp WR | RB/Opp WR | 6 |
Ownership and Stacks in 2021 Winning DraftKings Lineups
| Week | QB | RB1 | RB2 | WR1 | WR2 | WR3 | TE | Flex | Flex Pos | DEF | Cumulative | Average |
|---|---|---|---|---|---|---|---|---|---|---|---|---|
| 1 | 12.5% | 11.2% | 1.6% | 15.4% | 14.8% | 8.0% | 3.9% | 5.2% | WR | 2.6% | 75.2% | 8.4% |
| 2 | 12.9% | 26.3% | 15.5% | 24.6% | 16.0% | 1.1% | 7.8% | 12.6% | RB | 7.1% | 123.9% | 13.8% |
| 3 | 6.4% | 32.6% | 19.6% | 30.2% | 17.7% | 11.0% | 19.8% | 8.7% | WR | 9.1% | 155.1% | 17.2% |
| 4 | 11.5% | 10.2% | 5.6% | 14.5% | 14.2% | 12.6% | 2.3% | 3.4% | WR | 12.3% | 86.6% | 9.6% |
| 5 | 3.6% | 12.7% | 4.1% | 33.0% | 11.3% | 9.5% | 3.8% | 3.9% | WR | 6.9% | 88.8% | 9.9% |
| 6 | 4.1% | 29.9% | 22.4% | 23.5% | 8.8% | 2.8% | 12.4% | 16.4% | RB | 16.2% | 136.5% | 15.2% |
| 7 | 3.0% | 11.4% | 9.4% | 21.0% | 11.5% | 10.3% | 5.7% | 3.3% | TE | 13.6% | 89.2% | 9.9% |
| 8 | 20.6% | 23.3% | 4.5% | 17.4% | 12.8% | 11.9% | 10.3% | 8.6% | WR | 3.3% | 112.7% | 12.5% |
| 9 | 16.1% | 22.7% | 11.9% | 26.7% | 21.4% | 14.2% | 0.2% | 3.8% | RB | 5.1% | 122.1% | 13.6% |
| 10 | 14.0% | 8.5% | 3.2% | 13.6% | 5.5% | 2.8% | 5.1% | 0.8% | RB | 3.6% | 57.1% | 6.3% |
| 11 | 1.2% | 23.1% | 6.3% | 5.1% | 2.3% | 2.1% | 4.8% | 4.3% | RB | 4.8% | 54.0% | 6.0% |
| 12 | 5.8% | 17.1% | 8.9% | 27.0% | 8.8% | 5.1% | 17.7% | 2.9% | WR | 10.5% | 103.8% | 11.5% |
| 13 | 19.2% | 39.8% | 16.8% | 19.0% | 17.3% | 13.7% | 14.6% | 6.3% | RB | 8.6% | 155.3% | 17.3% |
| 14 | 10.0% | 22.8% | 2.2% | 13.2% | 10.3% | 9.6% | 16.3% | 1.4% | WR | 6.0% | 91.8% | 10.2% |
| 15 | 1.5% | 47.7% | 11.7% | 51.7% | 35.1% | 17.3% | 9.3% | 12.3% | WR | 7.9% | 194.5% | 21.6% |
| 16 | 10.8% | 37.6% | 35.4% | 53.4% | 20.5% | 11.2% | 10.2% | 1.6% | RB | 8.3% | 189.0% | 21.0% |
| 17 | 9.5% | 23.4% | 12.2% | 10.4% | 8.0% | 4.2% | 11.2% | 3.7% | RB | 7.7% | 90.3% | 10.0% |
| 18 | 9.7% | 26.6% | 9.8% | 18.1% | 13.4% | 3.8% | 11.7% | 3.8% | WR | 3.0% | 99.9% | 11.1% |
| AVG | 9.6% | 23.5% | 11.3% | 23.5% | 13.9% | 8.7% | 9.1% | 5.8% | 7.9% | 112.5% | 12.6% |
| Week | Primary Stack | Secondary Stack | Third Stack | Correlated Players |
|---|---|---|---|---|
| 1 | QB/WR | RB/TE/Opp WR | 5 | |
| 2 | QB/WR | RB/Opp WR | 4 | |
| 3 | QB/RB/WR/Opp TE | RB/WR | 6 | |
| 4 | QB/WR/Opp TE | RB/WR | 5 | |
| 5 | QB/RB/WR | RB/DEF | WR/WR | 7 |
| 6 | QB/WR/DEF | RB/WR | 5 | |
| 7 | QB/RB/WR/TE | RB/TE | WR/DEF | 8 |
| 8 | QB/WR | RB/Opp RB | 4 | |
| 9 | QB/WR | RB/Opp RB | 4 | |
| 10 | QB/WR/Opp WR | RB/TE | 5 | |
| 11 | 0 | |||
| 12 | RB/TE | WR/Opp WR | 4 | |
| 13 | QB/WR | 2 | ||
| 14 | QB/WR | RB/WR | 4 | |
| 15 | QB/TE/Opp WR | RB/WR/DEF | RB/Opp WR | 8 |
| 16 | QB/WR/WR/Opp TE | RB/Opp WR | RB/Opp RB | 8 |
| 17 | QB/WR/Opp RB/Opp TE | RB/Opp WR | 6 | |
| 18 | QB/WR | 2 |
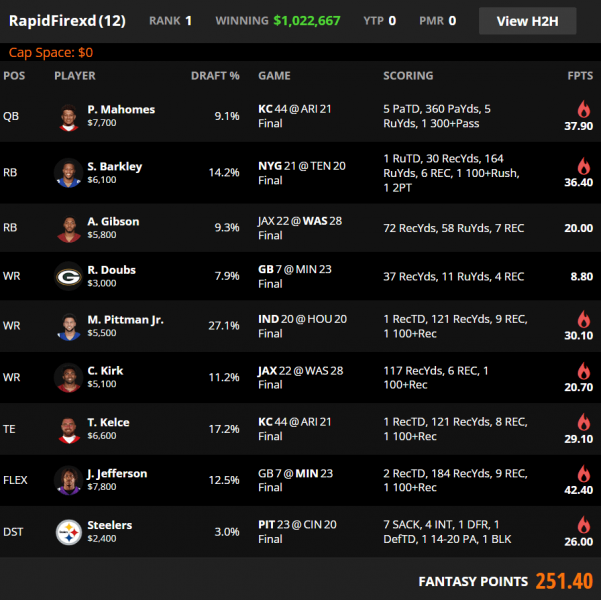
DraftKings Week 1 Millionaire Winning Lineup
Ownership
This week’s winning lineup had a cumulative ownership of 111.5%, a number higher than 11 Millionaire winners last year, despite there being over one million entries in Week 1’s contest. That high ownership was a result of just four players on the roster with sub-10% ownership and just one sub-5% play, the defense. Only two winners last season used just four sub-10% plays with one sub-5% roster spot. In the week with the most uncertainty all year, this is a result that strong GPP players should mostly be willing to accept since chasing the chalk is rarely a winning strategy in GPPs.
Fading high-priced running backs and differentiating at defense was the key to being unique in Week 1.
Stacks
On average, winning Millionaire lineups used between five and six correlated players in 2021 and that trend continued in Week 1 of the new season with six correlated players in the winning Millionaire lineups. This week’s winner took the long route to that number, though, with a single quarterback stack and two mini-correlations. Each week in my GPP breakdown, I offer my favorite secondary stacks to target.
Flex
DraftKings tournaments typically favor a wide receiver over a running back in the flex with nine Milly winners flexing a receiver in 2021, seven using a running back, and two flexing a tight end. The Week 1 winner reflected the dominant strategy in Week 1 as 66% of top-1% lineups in this tournament flexed a wide receiver compared to just 53% of the field.
Leverage
With the chalk hitting, there wasn’t much direct leverage off the players with the highest ownership projections but “flipping the build” was essential. The primary lineup strategy was rostering at least one high-salary running back but the Week 1 winner allocated less than $12,000 total to the position.

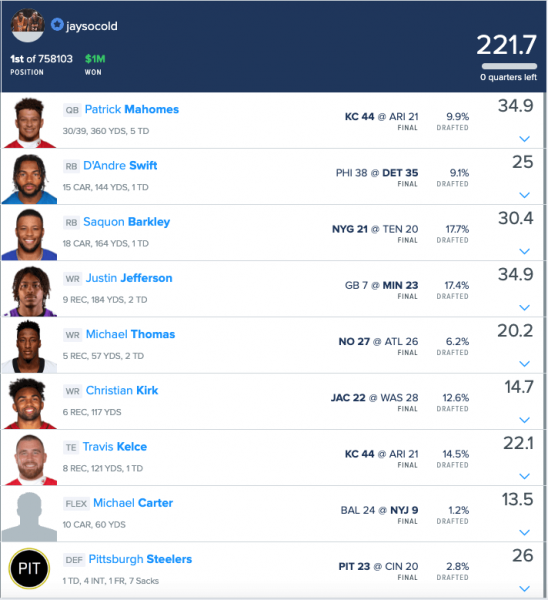
FanDuel Week 1 Sunday Million Winning Lineup
Ownership
Although the Week 1 Sunday Million winner used three heavily-rostered players, the cumulative ownership of the lineup was brought way down by two sub-5% plays. The 91.4% cumulative ownership of this lineup was lower than 11 Sunday Million winners last season. The average winning lineup in 2021 used at least one running back and one wide receiver with ownership of 20% or higher so although this week’s winners used chalky players, it avoided the highest-owned plays.
Stacks
One of the more unique elements of this lineup was the lack of stacking, using just a one-man quarterback stack with no other correlated players. Winning Sunday Million lineups correlated about five players, on average, and just three of 18 winners used fewer than four correlated players.
Flex
FanDuel has historically favored a running back in the flex but that shifted last year with half of Sunday Million winners using a fourth wide receiver and another winner flexing a tight end. This season kicked off with the winner using a third running back but there was a potentially disastrous blunder. Saquon Barkley was the highest-salary running back used on this roster and played in the late window but the lineup used Micahel Carter, who played early, in the flex. In all DFS lineups, use the highest-salary, latest-start player possible in order to maximize late-swap flexibility,
Leverage
Similar to DraftKings, avoiding a high-salary running back was a unique lineup construction and although there wasn’t much direct leverage in this lineup, there were some notable price pivots.
Dameon Pierce ($5,400) was expected to be among the most popular pay-down options at running back but a pivot to Michael Carter ($5,200) at 1.2% proved just enough after talk leading up to Week 1 suggested that Carter could see more work than rookie Breece Hall—playing a Jet while many rosters favored the Ravens was nice leverage. It was unclear whether Michael Thomas would be active in Week 1 but once he was activated, he was another play against a Raven as the popular Rashod Bateman was just $100 less than Thomas.


