The Fantasy Implications of Quarterback Change

Quarterback is often seen as the most important position in all of sports, not just football. This means we should be treating it as the most important position in fantasy football (despite the recent surge in the late-round quarterback drafting strategy). They can control everything from a team’s pace of play to their playmakers’ production, which means they are a vital consideration for fantasy football evaluation and strategy.
Teams changing quarterbacks from season to season also means seismic shifts in the fantasy football landscape, many of which can be tough to contextualize. Throughout this article, I will dive into what the fantasy football implications are of a team having a new quarterback. Specifically, I will evaluate the impact it has on team-level performance all the way down to the positions the quarterback supports.
Methodology
For the purpose of this article, I am defining a team’s primary passer as the quarterback with the most passing attempts in a season. There are obvious gaps in this methodology, but it was a concrete way to decide which quarterback was the primary passer without making further assumptions. I am also only looking at seasons since 2011. The NFL has changed so much over the past decade, I wanted to include only data relevant to today’s game. That means we’re looking at a sample of 320 quarterback seasons (32 teams times 10 years) in this analysis.
One thing to consider with the methodology outlined above is that a quarterback change doesn’t only occur by an incumbent starter being replaced by someone else but could also come because of injury. For example, in 2020, Dak Prescott was “replaced” by Andy Dalton after getting injured in Week 5 of the season. In this case, the 2020 Cowboys would fall under the “new quarterback” category even though they went into the season with the same starter year-over-year.
With that, let’s get into the analysis!
Team-Level Impact
Starting with a top-down approach to this analysis, I evaluated how a team performed overall when going through a quarterback switch, both from total team yardage and total team scoring perspectives. Here, I’m looking at only two subsets of teams—those with a new quarterback (as defined above) and those with the same quarterback year-over-year. This first chart displays teams’ percent change in total yards from year to year:
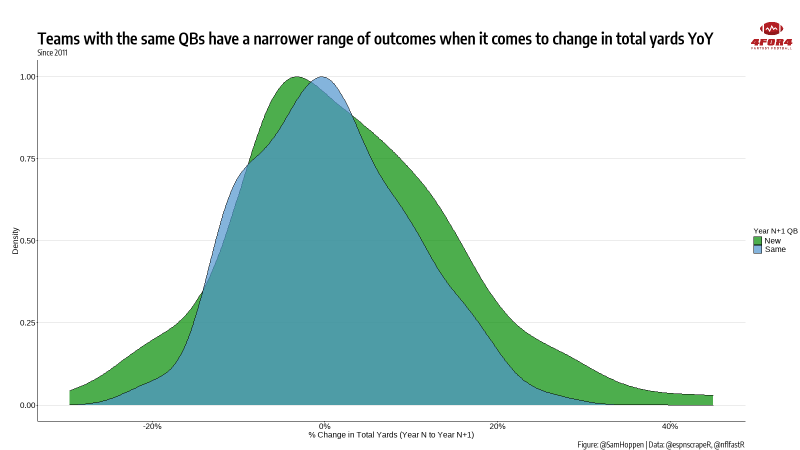 If you’re unfamiliar with density charts, they are designed to show the distribution of numeric data points where the peaks in the chart show higher concentrations at that level. For each of the density chart visualizations in this article, the horizontal x-axis will be the percent change in yards or scoring (see chart label) and the vertical y-axis is the density.
As you can see, teams with the same quarterback very often have little change (between a -10% and 10% change in yardage) year-over-year, while teams with new quarterbacks often see a much higher increase in offensive yardage. Part of this is due to teams with a new quarterback having more room for growth because they had a terrible season the year before. Intuitively, a team with a down year might blame it on the quarterback and look for a replacement to boost the offense. This effect is shown when we plot a team’s Year N total yards versus their Year N+1 total yards:

Finally, we see a similar trend for teams when we switch the view to total scoring for a team:

Scoring is a large factor in fantasy football success, but, again, this isn’t necessarily a bad sign for teams having the same quarterback each year. The teams with consistent quarterbacks might be performing at a higher level already, so they have further to fall. That said, this is rather convincing in showing that having a new quarterback doesn't mean doom and gloom for that offense.
Accounting for Rookies
You will notice the above evaluation did not differentiate whether the new quarterback was a rookie or not, so I created those same visualizations with rookies (who originally would have been put in the “New” group on the charts) as a group of their own.
In looking at the same two density charts as above with rookies included, the biggest takeaway is that rookie-led teams bring the most volatility.


Oftentimes we tend to temper expectations with rookie quarterbacks for a number of reasons—they have to learn a new system, they are usually on bad teams if starting, etc.—but this shows rookie quarterbacks can bring a boost to an offense that was once frightful.
What really stood out was visualizing the year-over-year yardage for teams with the rookie split included.

Since the yardage from all of the rookie quarterback seasons would be represented by the height on the y-axis, this clearly indicates that the ceiling for rookie-led teams isn’t nearly as high as those led by veterans. Apart from some outstanding seasons from the likes of Cam Newton, Russell Wilson and Dak Prescott, it can be difficult to bring an offense to its peak.
In any case, since there is some statistical difference in rookies versus new veteran quarterbacks, I will be using those three groups for the remainder of the analysis.
Playmaker Evaluation
Shifting gears, this final section will focus on players quarterbacks support—running backs, wide receivers and tight ends. To get a baseline of how well each of these positions performs with each of our different quarterback groupings, the following table shows the breakdown of top-24 running backs supported by each quarterback type.
| Quarterback Type | Top-24 RBs | Not Top-24 RBs | Top-24 RB Percent |
|---|---|---|---|
| Rookie | 21 | 117 | 15.2% |
| New | 78 | 364 | 17.6% |
| Same | 161 | 654 | 19.8% |
As noted above, there are only 35 rookie seasons (out of a possible 320) that are counted in this, so there are inherently going to be fewer players in the rookie bucket. To explain this table, you can read it as there being 21 running backs who recorded a top-24 season when supported by a rookie quarterback and 15.2% of all running backs supported by a rookie quarterback went on to have a top-24 season. Not too shabby! Zooming in on top-12 running backs, the results are even better:
| Quarterback Type | Top-12 RBs | Not Top-12 RBs | Top-12 RB Percent |
|---|---|---|---|
| Rookie | 11 | 127 | 8.0% |
| New | 34 | 408 | 7.7% |
| Same | 85 | 730 | 10.4% |
Here we see there’s a higher percent of running backs on rookie-led teams finishing in the top 12 than there are running backs on new, veteran-led teams. Running backs on teams supported by rookie quarterbacks aren’t impacted quite that much and have a decent hit rate. This should not be a major surprise as running back performance can be tied a bit more to team-level production and aren’t as reliant on direct quarterback play (unless they serve as a pass-catching specialist a la James White or Duke Johnson). Next, we will look at wide receivers and tight ends, which are a bit more worrisome.
| Quarterback Type | Top-24 WRs | Not Top-24 WRs | Top-24 WR Percent |
|---|---|---|---|
| Rookie | 9 | 221 | 3.9% |
| New | 76 | 596 | 11.3% |
| Same | 173 | 1022 | 14.5% |
| Quarterback Type | Top-12 TEs | Not Top-12 TEs | Top-12 TE Percent |
|---|---|---|---|
| Rookie | 8 | 113 | 6.6% |
| New | 38 | 318 | 10.7% |
| Same | 85 | 579 | 12.8% |
Again, the numbers for all positions with rookie quarterbacks are inherently going to be lower because there have been fewer seasons in which a rookie quarterback was the lead passer, but this is staggeringly low for both positions. To put these stats into more context, this data tells us that there is about one top-24 wide receiver (and one top-12 tight end) for every four rookie-led teams. The picture doesn’t get much better when we focus on top-12 wide receivers and top-six tight ends, either.
| Quarterback Type | Top-12 WRs | Not Top-12 WRs | Top-12 WR Percent |
|---|---|---|---|
| Rookie | 3 | 227 | 1.3% |
| New | 33 | 639 | 4.9% |
| Same | 92 | 1103 | 7.7% |
| Quarterback Type | Top 6-TEs | Not Top-6 TEs | Top 6-TE Percent |
|---|---|---|---|
| Rookie | 1 | 120 | 0.8% |
| New | 19 | 337 | 5.3% |
| Same | 46 | 618 | 6.9% |
The only three receivers to record a top-12 wide receiver season were Percy Harvin (Christian Ponder, 2011), Steve Smith (Cam Newton, 2011) and Reggie Wayne (Andrew Luck, 2012). Overall, this should be a major red flag for anyone considering drafting wide receivers or tight ends on teams like the Jaguars and Jets, who figure to be led by rookies in 2021.
Bottom Line
Already, we know at least nine teams (Jets, Colts, Football Team, Cowboys, Eagles, Bears, Lions, Saints, Rams), with the possibility of several more (Panthers, 49ers, Texans, and Jaguars) will have a new leading passer in 2021—nearly half of the league!
Right now, several mock drafts have four quarterbacks (or even five) going in the top 10 picks of the NFL Draft next week. Using the data from above, we would expect just one top-24 wide receiver across all four teams that draft a quarterback (assuming they all become the primary passer).
This analysis, by no means, should be taken as “I need to only draft players on teams that have the same returning quarterback” because there is still value in players on teams with a new quarterback (rookie or veteran). What this analysis should serve as is a way to manage expectations for those playmakers. Specifically, if we do see mid-season quarterback changes from teams (a la the Cowboys, as referenced above), we can get a general sense of how those teams might perform for the rest of the season relative to how they had performed in the past.
Hopefully, this gave a lens into one part of the ever-changing nature of the NFL. Surely, there is a lot more than just a quarterback that influences a team’s performance, but as I mentioned at the top, they control a lot in the game.
Related Articles