How Offensive Line Play Impacts Fantasy Football

Fantasy football is hard. Each year begins anew with a draft class chock full of names you’ve likely only heard of in the two months prior, free-agent signings with unknown statistical impact, coaching hires, and coordinator promotions that can and will affect play calling. It’s a lot to wrap your head around. But this doesn’t stop us from logging on and scouring the internet for edges on our opponents through Twitter, draft guides, and, of course, 4for4, the most useful tool you can be using. Yet amongst the thousands of articles and tweets at your disposal, there is still a key component left out by the most astute writer’s analytical process: the offensive line.
Outlier plays (and players) can make “broken” plays, or scramble drills make it seem like talent can rise above a lack of blocking. Maybe it can, but not for a sustained amount of time. What we’re looking for from our fantasy players is predictability and, in our season-long leagues, consistency. What is consistent is the fact that all quarterbacks in the league have a lower quarterback rating when pressured than when kept clean. A quarterback’s yards and completion percentages are the third and fourth-most sticky statistics year-over-year, both exceedingly difficult things to do with a hand in your face or your back on the ground.
In the running game, it should come as no surprise when teams that emphasize investing in their offensive line and creating unique schemes produce consistent fantasy-relevant running backs. Some of the best run-blocking units in the last half-decade have generated backfields we are prone to target. The Colts, Titans, Rams, Saints, and 49ers all fall into that category.
For the remainder of this article, I’ll be explaining the methods to the madness of quantifying offensive line play and exactly how we can translate that into actionable information pertaining to counting stats and fantasy football.
Relevant Offensive Line Statistics
Below are some of the basic stats I used to create my offensive line metric, which ranks each team’s offensive line. Weighted in terms of importance, the final score attempts to measure exactly how much an O-Line will help or hurt a team's fantasy output.
- QB Pressures Allowed – Simply, the number of times a team’s quarterback was pressured by the defense during a pass play.
- Adjusted Sack Rate – From Football Outsiders, “Adjusted Sack Rate, which gives sacks (plus intentional grounding penalties) per pass attempt adjusted for down, distance, and opponent.” My favorite part of this stat is the down and distance bit of the metric, as it weighs a drive-killing sack on 3rd-and-1 more heavily than a 3rd-and-25 sack during a fledgling drive.
- Adjusted Line Yards – Coming from FO again, this formula assigns responsibility to the offensive line to varying degrees depending on the length of a run (0–4 yards, 5–10 yards, 11+ yards, and loss of yardage). Those numbers are adjusted by “down, distance, situation, opponent and the difference in rushing average between shotgun compared to standard formations”.
- Number of Rookies – This is simply the number of rookies who logged at least one snap on the O-Line throughout the season. This will make a quick reference point for teams still developing youth in the trenches.
- Number of Offensive Line Penalties – This incorporates all penalties assessed to offensive linemen on a team, though holding calls and false starts generate a vast majority of the numbers. I’ve decided to include all penalties, whether accepted or declined, as it is not possible to parse out exactly whether a call should have been made (or accepted) without watching each penalty individually. And believe me, we both have better things to be doing with our time. Though this is not an all-encompassing stat for judging a team’s discipline, it’s important to see which teams have been more likely to kill drives with mistakes.
- Blown Blocks - Sports Info Solutions’ metric for how often a player does not successfully block the defender they attempted to engage. This is represented in the overall metric in terms of percentage; the higher percentage the team misses a defender, the bigger a detriment to their overall grade.
- Coach Tenure - A numerical representation of how long teams have been able to coach the same types of blocking schemes season-to-season. This is simply how long the offensive line coach has been with the team. Another attempt to quantify continuity.

How this Data Correlates to Fantasy Points
To put these statistics into relevant context, I have graphed each offensive line statistic versus every team’s 2021 total half-PPR points to find the r-squared on a fitted regression line. A table of the full findings follows, but I wanted to include one of the graphs to help explain what this process looks like (and to show my work a little bit).
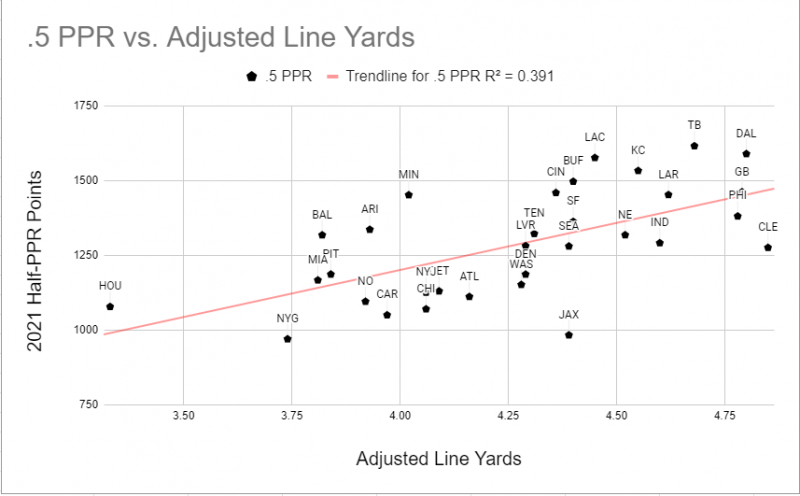
Adjusted line yards do a decent job on their own in regards to predicting fantasy scoring for an NFL team. The ability to gain yards on the ground is clearly a path to fantasy points, but these teams are also more likely to sustain longer drives that end in the end zone. It helps that a majority of the teams in the top-right cluster (Buccaneers, Chiefs, Rams, Cowboys, etc.) also have a strong passing-game backbone that further exploits the defense. While three of those teams have a long history of great trenchmen, it was truly remarkable what Kansas City was able to do with five players who had never taken a snap together, a triumph for ninth-year offensive line coach Andy Heck.
This would be as good of a time as any to clarify that I’m not trying to say that the quality of an O-Line is going to be the end-all, be-all of why teams can/cannot score fantasy points; I just want to illustrate that they are a bigger piece of the puzzle than they are given credit for.
The adjusted line yards metric offered the highest correlation (39%) to fantasy points of any of the individual statistics I delved into, but let’s take a look at the rest.
| O-Line Metric | Correlation |
|---|---|
| Adjusted Line Yards | 0.39 |
| Blown Block% | 0.34 |
| Adjusted Sack Rate | 0.28 |
| QB Pressures Allowed | 0.13 |
| Coach Tenure | 0.08 |
| Number of Penalties | NULL |
We’ve got some stinkers in there, but once again, I’m not trying to explain away an entire season of fantasy success (or lack thereof) because a team had a handful more holding calls than the competition. We’re attempting to flesh out which of these mean the most to fantasy production and seeing if we can use offensive line statistics to help explain —and predict— skill position usefulness.
We have some acceptable correlations from this exercise, and I would be satisfied knowing that an offensive line’s adjusted sack rate could explain a quarter of that team’s fantasy points or even that the number of pressures they allowed could explain an eighth of a team’s cumulative fantasy points. I think we can make these numbers even more descriptive without actually changing the numbers, but how?
As I’ve often preached, this data and the offensive line work I do generally are better used to discover the outlier teams to avoid or attack. Meaning let’s target teams in the top 10 and avoid teams in the bottom 10 for offensive purposes and the opposite for defensive purposes. Can we make these correlations look better if we exclude the teams ranked 11th through 22nd and instead focus on the best and worst teams?
| O-Line Metric | Correlation |
|---|---|
| Adjusted Line Yards | 0.50 |
| Blown Block% | 0.44 |
| Adjusted Sack Rate | 0.41 |
| QB Pressures Allowed | 0.25 |
| Coach Tenure | 0.11 |
| Number of Penalties | 0.02 |
Each of our featured statistics either stays put or becomes more descriptive when we eliminate the middle of the spectrum to shine the lights on the highs and lows of offensive line play. But there are still some frayed ends to clean up here. What if we incorporate all of these into a single metric, weighted by statistical importance, and use that to compare against a team’s fantasy production? Funny, you should ask.
What's this all-encompassing metric, and does it correlate well?
| O-Line Metric | Correlation |
|---|---|
| All-Encompassing Offensive Line (AEOL) | 0.46 |
| Adjusted Line Yards | 0.39 |
| Blown Block% | 0.34 |
| Adjusted Sack Rate | 0.28 |
| QB Pressures Allowed | 0.13 |
| Coach Tenure | 0.08 |
| Number of Penalties | NULL |
It may not surprise us that when we add more information to our model, the outcome is better than when we have less information, but you can be assured that it at least gives your humble author a sigh of relief. The all-encompassing offensive line metric that I use as the baseline for my off-season and weekly rankings does a better job explaining fantasy prowess than any singular statistic in this study.
Now let’s take a look at our weighted metric when we compare only to the top-10 and bottom-10 units.
| O-Line Metric | Correlation |
|---|---|
| All-Encompassing Offensive Line (AEOL) | 0.63 |
| Adjusted Line Yards | 0.5 |
| Blown Block% | 0.44 |
| Adjusted Sack Rate | 0.41 |
| QB Pressures Allowed | 0.25 |
| Coach Tenure | 0.11 |
| Number of Penalties | 0.02 |
Now we’re talking. A correlation of 0.63 for the AEOL before we even factor in who is touching the ball is pretty impressive, if I do say so myself. Yes, someone has to touch the ball to get sacked, or get hit behind the line, or miss the gap that has been blocked for them, but I’ve chosen these statistics due to how well I believe they do a very difficult task —separate offensive line play from a team’s skill position players.
By adding context (film watching, injuries, competition, etc.) to this significantly strong baseline, we now have a formula that can lead us towards fantasy options on good blocking teams and away from fantasy options on poor blocking teams.
There are outliers, and there will always be outliers, but it doesn’t mean we can’t use offensive line play as another data point when deciding on who to roster and play.
Further Reading
A (very reasonable) question I’ve received a lot in the past is how (or if) we can separate my offensive line research into buckets of rushing and passing. While a very valid inquiry (and one I’m not apt to give up on any time soon), the short answer is “no.” For the time being, I believe this metric and the rankings that will come from it are best looked at in an environmental sense. Good offensive lines equal a good environment for increased yardage and are less likely to allow drives that stall into punts and field goals.
Once we get into massive, lengthy rankings articles, there will be a lot to parse out, and some offensive linemen are objectively better in pass protection than they are in run-blocking, but as of now, the football community does not have much in the way of data to back that up. That information will come wholly from the eye test, so you’ll just have to keep your eye on the 4for4 front page as offensive line content continues through the summer.
Bottom Line
- By strengthening the offensive line, NFL teams create ripe situations for fantasy production.
- No single statistic can explain all of a team’s output but if we weigh the important ones, we get a better idea of how much they influence a skill position player's stock.
- Providing context and creating rankings of all 32 units will give us an advantage over fantasy owners who ignore this vital piece of the pie.