FanDuel Cash Games and GPPs: A 2019 Review

Reviewing DFS lineups and game selection is essential in the process of being a winning player, but those who play relatively little volume may find it tough to discern whether their results are reflective of their actual skill level or a function of variance. By examining winning scores and lineups from 2019 cash games and GPPs on FanDuel, this recap will act as a manual for what it takes to win at various games across stakes. The point thresholds outlined here can be used as a reference point to examine if you were consistently building lineups that would be profitable over the long term in your game(s) of choice.
For this study, I focused on featured games from the main slate. Disciplined game selection could uncover games that may be beatable with lower point thresholds. For more on proper game selection, consider the Guide to Game Selection and this podcast theory segment.
FanDuel Cash Games
Double Ups
The featured cash games on FanDuel are Double Ups where fields range from 100+ entries up to 35,000. Because of rake and payout concerns, head-to-heads or 50/50s are usually a better long-term investment than Double Ups, but low-volume players should generally avoid head-to-head games and it can often be tough to find 50/50s on FanDuel with large fields. Opting for large-field Double Ups can help low-volume players recognize a return on investment that is truly reflective of their skill by exposing their lineups to a large sample of opponents.
Before blindly firing at any Double Up, though, recognize that there are differences between contests that should be noted. The size of the field and the buy-in are obvious factors that come into play but the number of maximum entries allowed is probably the most important variable to consider. The difference between a single-entry Double Up and a multi-entry game can have a noticeable shift on the cash line of a game and, ultimately, one’s expected win rate. When profitable players can roll out one lineup 150 times in a single contest, the expected value for a less-experienced player declines sharply.
The following table highlights the average cash line (minimum score needed to cash) from Weeks 1–17 for featured Double Ups on FanDuel at various stakes.
| Buy-In | Multi-Entry Double Up | Single-Entry Double Up | Difference |
|---|---|---|---|
| $1 Beginner | - | 122.26 | - |
| $2 | 135.46 | 133.46 | 2.00 |
| $2 Beginner | - | 123.55 | - |
| $5 | 136.14 | 134.17 | 1.97 |
| $10 | - | 134.65 | - |
| $11 | 137.55 | - | - |
| $25 | 136.95 | 133.05 | 3.90 |
| $50 | 134.17 | - | - |
| $100 | 130.26 | - | - |
Click headers to sort.
There are two takeaways here that should stand out: the difference between single-entry and multi-entry Double Ups and the difference between Beginner and non-Beginner contests. From the $2 to the $25 level, owners needed to average almost three more points in multi-entry Double Ups than in single-entries (grouping $10 and $11 Double Ups together) in order to cash and the difference was nearly four points at the $25 level, specifically. In larger contests, a three-point difference can be a jump of hundreds—if not thousands—of players and cashing just a couple extra weeks by seeking a lower cash line can be the difference between a profitable and losing season. Players who are not long-term, high-volume winners should almost always seek out single-entry cash games.
FanDuel offers exclusive games to beginners (players who have competed in fewer than 50 contests) and those contests have a markedly lower cash line than games open to all players. Before looking at any other games, novice players should prioritize Beginner contests over everything else.
The average cash lines for the $50 and $100 contests might make it seem like players at the $25 should consider moving up in stakes but the $50 game ran just 14 times all season while the $100 game ran just eight times, leaving the results susceptible to a couple of outliers—games at the lower stakes ran multiple times every week.
There were many instances, however, of the higher-stakes Double Ups not filling so those that are considering moving up a level might consider doing so when they can find a game that doesn’t fill and results in a reduced rake.
Head-to-Heads
For this study, I tracked nearly 2,000 head-to-head contests at the $1–$5 levels on FanDuel. The following shows the distribution of scores across those games.
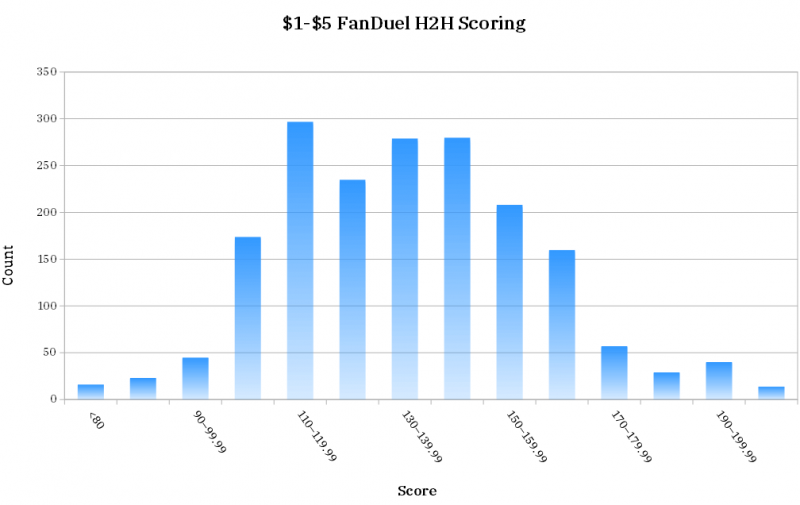
Average Winning Score: 143.95; Overall Average: 135.87
Astute readers might immediately notice that the average winning score in head-to-heads is much higher than the cash lines for Double Ups but the explanation is simple—the cash line in Double Ups is the minimum winning score while the average seen here for head-to-heads includes all winning scores, which drives up the average. Another point that should be made here is that the approach to building head-to-head lineups should not be the same as building Double Up lineups. There is an incentive to building some volatility into lineups for a high-volume head-to-head since the only way to sweep a week is to have an outlier high score. If the majority of players are adhering to this strategy, then it makes sense that winning scores in head-to-heads will be higher than in Double Ups.
For a nuanced discussion on lineup-building strategy, listen to this DFS MVP theory segment.
The distribution of scores shown above should encourage users who have wondered if cash games are still beatable. The majority of players (nearly 60%) in this sample are building lineups that are scoring fewer than 140 points. If you are consistently building lineups that are scoring near or above 140 points, you should be able to post a win rate well above the 56% required to break even in head-to-heads. Players who have played exclusively 50/50s and Double Ups that are looking to increase volume and smooth out their week-to-week variance (1.) can use this point threshold as a marker of whether or not to make the leap to head-to-heads.
FanDuel GPPs
This section will review the average scores needed to cash in various main slate featured contests on FanDuel but it will also highlight the average winning scores. Additionally, a summary of the data presented in the weekly TJ’s #Taeks will show how winning players were constructing their lineups in 2019.
Average Cash Lines and Winning Scores
The table below lists the average cash lines and average winning scores for the most popular and most consistently available weekly GPPs on FanDuel. A zoomed-out look at all of FanDuel’s weekly featured contests should allow us to tease out some actionable takeaways, both for lineup-building and game selection considerations.
| Contest | Buy-In | Avg # Players | Max Entries | Max Entries | Avg Cash Line | Avg Winning Score | Min winning Score | Max Winning Score |
|---|---|---|---|---|---|---|---|---|
| Pooch Punt | $0.05 | 396627 | 150 | 150 | 135.12 | 224.80 | 193.10 | 278.10 |
| Hail Mary | $0.25 | 290847 | 150 | 150 | 135.29 | 224.24 | 188.20 | 271.34 |
| Dive | $1 | 165616 | 150 | 150 | 133.89 | 221.86 | 184.90 | 287.44 |
| Squib | $1 | 33963 | 1 | 1 | 134.21 | 212.63 | 183.62 | 266.64 |
| Snap | $2 | 39062 | 20 | 20 | 135.00 | 215.56 | 187.78 | 268.90 |
| Safety | $2 | 17927 | 1 | 1 | 136.63 | 209.02 | 181.40 | 266.64 |
| Snap | $3 | 44047 | 150 | 150 | 136.12 | 217.40 | 187.50 | 274.94 |
| Three and Out | $3 | 7819 | 3 | 3 | 137.51 | 207.82 | 178.44 | 264.46 |
| Snap | $4 | 35976 | 150 | 150 | 137.16 | 216.56 | 187.40 | 269.74 |
| Spike | $5 | 25202 | 1 | 1 | 136.40 | 212.52 | 185.30 | 276.54 |
| Rush | $6 | 35214 | 150 | 150 | 136.76 | 217.79 | 185.30 | 280.14 |
| Flea Flicker | $7 | 3791 | 5 | 5 | 139.15 | 205.18 | 176.14 | 262.94 |
| Sunday Million | $9 | 275457 | 150 | 150 | 134.44 | 222.60 | 188.66 | 285.64 |
| Scramble | $10 | 5609 | 1 | 1 | 138.55 | 203.50 | 177.14 | 258.04 |
| Onside Kick | $15 | 2255 | 3 | 3 | 138.90 | 201.66 | 172.50 | 258.04 |
| Kickoff | $22 | 14591 | 150 | 150 | 137.89 | 211.94 | 181.82 | 263.94 |
| Sweep | $25–$33 | 3818 | 1 | 1 | 139.47 | 202.39 | 174.34 | 250.44 |
| Bomb | $44–$55 | 9570 | 150 | 150 | 137.95 | 210.52 | 174.90 | 264.24 |
| Hot Route | $50 | 1244 | 1 | 1 | 140.36 | 197.19 | 166.80 | 258.04 |
| Touchdown | $65 | 533 | 3–5 | 4 | 140.57 | 192.85 | 167.88 | 242.34 |
| Stiff Arm | $75 | 645 | 1 | 1 | 140.53 | 192.60 | 169.80 | 235.20 |
| Cover 2 | $100 | 1145 | 1 | 1 | 139.62 | 193.48 | 163.32 | 258.04 |
| End Zone | $150 | 352 | 3 | 3 | 140.68 | 189.14 | 165.38 | 238.86 |
| Fade | $222 | 367 | 1 | 1 | 141.70 | 189.76 | 162.00 | 231.54 |
| Luxury Box | $535 | 140 | 1 | 1 | 141.62 | 183.31 | 148.78 | 228.02 |
Click headers to sort.
Readers should use this table to find the games that are most similar to their usual contest(s) and see if they are consistently posting scores that can be profitable in these games, in turn, possibly finding leaks in game selection.
As noted in the Double Up section, players who qualify for Beginner contests should invest in those games before anything else. The $3 Huddle saw the lowest average cash line of any GPP that ran regularly and these contests also offer a reduced 10% rake, compared to 16% for other GPPs at the same price point.
Those that don’t qualify as Beginners should still take note of the differences in average scores.
Isolating variables (buy-in, field size, max entries) as they relate to average scores in GPPs is difficult but in this sample (excluding the Beginner contests), the average number of entries had the strongest relationship to both the average cash line and the average winning score—average entries showed a correlation coefficient of -0.62 with the cash line and 0.67 with the average winning score.
In other words, the more entries in a contest, the lower the average cash line, and the higher the average winning score and vice versa. There are at least two explanations for this.
Fewer entries mean fewer combinations of lineups which results in a lower likelihood of outliers on either end—this part should be intuitive. A more theoretical explanation is that in smaller fields, players are likely taking fewer risks in lineup construction, opting for builds that are closer to optimal in a point projection system. Add in the fact that games with larger fields and bigger prize pools tend to attract more casual players and dead money, and it’s clear why smaller games tend to have higher cash thresholds and can be taken down with more modest scores than games at similar buy-in levels with far more players.
Here’s what 4for4’s data scientist, Kevin Zatloukal had to say about his findings:
“You can get a really good fit to the average winning score using the log of the number of players and max entries. The best fit...for FD is:
160.1 + 3.60 * LG(# entries)
where "LG" is log base 2. That gives the average winning score with an R^2 of 0.97, so it's a very tight fit.
Doubling the number of players [in the field] adds about 3.60 more points to the score required to win.
One way of using that information is to decide between lineups based on their expected points and standard deviation [of a player]. You would need a score that it is 1.2–3.2 standard deviations above the mean for the optimal lineup in order to win, with 1.2 the number for a field of 12 entries and 3.2 for 300k entries.”
What Kevin is essentially saying here is that although a player may be projected for more points than another, it’s often more beneficial to favor a player with a lower point projection but a wider range of outcomes. As the size of the tournament increases, the more high-variance players we want. This, of course, is elementary for anyone familiar with DFS but Kevin’s analysis quantifies the logic.
This isn’t to say that you should take bigger risks at every lineup spot just because the tournament has a large field—remember that larger-field tournaments generally have lower cash lines. Ownership numbers from last year’s winning GPP lineups on FanDuel reiterates this.
Roster Construction - Ownership
Throughout the season, I track winning lineups for the FanDuel Sunday Million, logging data on how much winners spend on each roster spot and how popular every lineup is, as a whole and on the player level. The following table shows ownership percentages for every winning Sunday Million lineup from 2019.
| Week | QB | RB1 | RB2 | WR1 | WR2 | WR3 | TE | Flex | RB or WR Flex? | DEF | Average |
|---|---|---|---|---|---|---|---|---|---|---|---|
| 1 | 10.0 | 28.1 | 25.0 | 20.9 | 7.5 | 4.1 | 3.4 | 19.1 | RB | 5.4 | 13.7 |
| 2 | 14.3 | 23.0 | 13.9 | 8.6 | 3.9 | 0.6 | 19.7 | 8.9 | RB | 20.2 | 12.6 |
| 3 | 2.9 | 24.4 | 11.4 | 13.2 | 11.2 | 1.8 | 13.2 | 6.5 | RB | 12.2 | 10.8 |
| 4 | 5.3 | 12.7 | 11.1 | 23.3 | 3.8 | 0.6 | 23.7 | 3.5 | RB | 1.5 | 9.5 |
| 5 | 16.9 | 43.5 | 6.4 | 20.3 | 14.7 | 11.1 | 15.4 | 9.2 | WR | 9.0 | 16.3 |
| 6 | 11.5 | 19.5 | 9.2 | 21.8 | 15.4 | 11.0 | 30.8 | 6.9 | RB | 4.5 | 14.5 |
| 7 | 2.9 | 34.7 | 15.6 | 14.4 | 1.8 | 1.7 | 7.3 | 5.4 | RB | 0.3 | 9.3 |
| 8 | 2.0 | 35.8 | 29.2 | 31.5 | 11.3 | 7.0 | 9.6 | 3.7 | RB | 6.8 | 15.2 |
| 9 | 15.8 | 31.2 | 4.8 | 25.9 | 23.9 | 12.8 | 8.8 | 4.5 | WR | 15.4 | 15.9 |
| 10 | 15.3 | 16.2 | 14.2 | 38.6 | 27.7 | 17.1 | 7.8 | 11.4 | RB | 13.9 | 18.0 |
| 11 | 7.4 | 26.6 | 9.4 | 26.0 | 13.1 | 9.7 | 5.5 | 5.5 | WR | 5.9 | 12.1 |
| 12 | 13.7 | 19.9 | 17.7 | 35.9 | 11.8 | 10.4 | 32.4 | 9.7 | WR | 3.9 | 17.3 |
| 13 | 4.4 | 42.8 | 39.4 | 16.9 | 13.5 | 11.7 | 6.7 | 1.1 | RB | 16.3 | 17.0 |
| 14 | 1.2 | 15.3 | 12.3 | 12.3 | 10.1 | 8.4 | 10.4 | 2.0 | WR | 13.3 | 9.5 |
| 15 | 5.7 | 46.5 | 5.3 | 7.4 | 5.0 | 5.0 | 20.9 | 5.3 | RB | 4.5 | 11.7 |
| 16 | 2.4 | 23.7 | 22.7 | 27.5 | 16.3 | 20.5 | 4.1 | 12.9 | RB | 12.0 | 15.8 |
| 17 | 8.3 | 14.8 | 12.6 | 22.7 | 11.1 | 11.1 | 32.1 | 7.7 | RB | 18.1 | 15.4 |
| AVG | 8.2 | 27.0 | 15.3 | 21.6 | 11.9 | 8.5 | 14.8 | 7.3 | 9.6 | 13.8 |
Click headers to sort.
Large-field tournaments require a contrarian mindset, but just as Kevin discussed selectively embracing volatility in terms of player projections, one only has to be selectively contrarian in even the biggest tournaments. Not only did winning lineups show average ownership near 14% but only three winning Sunday Million lineups had average ownership below 10%.
A position-by-position breakdown of ownership allows for a more specific look at how winning lineups balanced chalk with contrarian plays.
Quarterbacks
When it comes to fantasy, the scoring curve is generally quite flat across the quarterback and that translates to ownership numbers since bottom- and mid-tier passers can, and do, match the weekly production of their elite counterparts on a regular basis. Because quarterback scoring is so replaceable, the position had the lowest average ownership in winning Sunday Million lineups outside of the Flex, with 10 of 17 winners using a signal-caller that was rostered on fewer than 10% of lineups.
On the flip side, nearly 20% of winners used a quarterback that was rostered in at least 15% of lineups, a high ownership number for the position. Building a stack around a solid core is a profitable plan. On FanDuel, you can make the stack contrarian by pairing a popular quarterback with a unique pass catcher but it’s often the unpopular quarterbacks that are the winners.
Running Backs
Top-tier running backs have dominated the fantasy landscape in recent years and that is reflected in winning Sunday Million lineups where every RB1 was owned in at least 13% of lineups and only five RB2s carried single-digit ownership. Because running back volume is so predictable, it’s often fine to follow the crowd in even the largest tournaments but this wasn’t the only position where following the chalk was profitable last season. Of the 35 players winning Sunday Million lineups with at least 20% ownership, 16 were running backs.
Wide Receivers
A common narrative in DFS is that going against the grain by rostering unpopular wide receivers makes sense because the position sees so little volume compared to running backs or quarterbacks, that production can be wildly unpredictable on a week-to-week basis. While this is true to an extent, there are only a handful of players in the league who approach double-digit targets every week, and the ones that get those opportunities are usually the most popular DFS plays.
Winning lineups show that building around even the most popular pass-catchers can be a profitable strategy, as long as those chalk roster spots are offset by unique players elsewhere, often the WR3 and Flex positions. Only twice last season did someone take down the Sunday Million with three wide receivers in fewer than 10% of lineups and seven winners rolled out three receivers with double-digit ownership. Again, selectively embracing volatility is a winning tactic in large-field contests, and applying that logic to a team’s third wide receiver makes sense. This is a player that is rarely going to see huge target numbers or get predictable scoring opportunities so it represents a great spot to make a lineup unique.
Tight Ends
The tight end landscape has shifted in recent years and that has been reflected in fantasy circles. Traditionally, tight end is a good spot to be contrarian since the position sees even less volume than wide receivers but the recent gap between the top five or six tight ends and the rest of the field has expanded along with a shrinking pool of usable tight ends outside of the top tier. This has led to a concentration of weekly ownership numbers at the position, with a handful of players often representing the vast majority of tight ends in a given field.
With the average ownership of tight ends nearly as high as that of RB2s in winning Sunday Million lineups, rostering a somewhat popular tight end should be a viable strategy despite the inherent volatility at the position unless a new crop of reliable options pops up at the position in 2020.
Flex
For this study, the Flex was defined as the lowest-owned RB3 or WR4 on a roster.
In 2018, winning Sunday Million lineups were dominated by running backs in the Flex when just two winners deviated from a third running back strategy. There was a slight shift in 2019, however, as five winning lineups implemented a wide receiver in the Flex. Returning to Kevin’s analysis on embracing volatility in large fields, it makes sense to have exposure to a fourth wide receiver despite the fact that FanDuel’s scoring system largely favors a third running back, especially if the overwhelming majority of lineups in a tournament such as the Sunday Million are opting for running back in the Flex.
Remember, though, that 12 of the 17 winners still used a third running back. The lesson here is to not be married to one lineup-building strategy. A tournament portfolio should still slant running back on FanDuel but not to the extreme. Regardless of which position you choose here, note that the Flex carried the lowest average ownership of any position in winning Sunday Million lineups. There were only three instances of a winner using a player that was owned in more than 10% of lineups in the Flex and each time that player was a running back.
Defense
Defense, like quarterbacks, is a onesie position with generally flat scoring and ownership, which is why we see a relatively smooth ownership curve among the winners. Limiting your player pool to defenses that will be ahead, especially against teams that already throw a lot, is a fine strategy—not shying away from games that might be high scoring is a sneaky way to be contrarian. Big point totals often involve defense and special teams scores.
Roster Construction - Salary
Note that designations such as RB1 and WR1 in this section refer to the highest-priced player at the position on each roster. Consequently, the RB1 in terms of salary may not necessarily match up with the RB1 in terms of ownership above.
| Week | QB | RB1 | RB2 | WR1 | WR2 | WR3 | TE | Flex | RB or WR Flex? | DEF | Total |
|---|---|---|---|---|---|---|---|---|---|---|---|
| 1 | $7,400 | $8,900 | $7,900 | $6,900 | $6,300 | $5,600 | $5,400 | $7,400 | RB | $4,200 | $60,000 |
| 2 | $9,000 | $8,500 | $7,900 | $5,300 | $5,200 | $4,700 | $8,000 | $6,500 | RB | $4,900 | $60,000 |
| 3 | $6,000 | $8,900 | $7,100 | $7,800 | $7,100 | $6,000 | $6,400 | $7,000 | RB | $3,700 | $60,000 |
| 4 | $7,700 | $7,300 | $6,800 | $7,100 | $7,100 | $7,000 | $6,800 | $6,400 | RB | $3,800 | $60,000 |
| 5 | $8,000 | $6,800 | $6,800 | $7,700 | $6,900 | $6,500 | $6,600 | $5,700 | WR | $4,900 | $59,900 |
| 6 | $7,700 | $8,500 | $6,900 | $8,500 | $6,400 | $5,800 | $6,400 | $5,300 | RB | $4,500 | $60,000 |
| 7 | $7,600 | $8,300 | $7,600 | $8,000 | $6,300 | $5,600 | $6,200 | $6,500 | RB | $3,800 | $59,900 |
| 8 | $6,900 | $7,700 | $6,200 | $7,700 | $7,400 | $6,700 | $6,700 | $6,200 | RB | $4,500 | $60,000 |
| 9 | $8,600 | $9,700 | $6,300 | $7,500 | $6,700 | $5,700 | $6,000 | $5,500 | WR | $4,000 | $60,000 |
| 10 | $8,600 | $7,600 | $7,000 | $8,700 | $6,300 | $5,700 | $5,000 | $6,000 | RB | $5,000 | $59,900 |
| 11 | $7,800 | $8,400 | $7,800 | $7,300 | $6,000 | $5,900 | $6,200 | $5,500 | WR | $5,000 | $59,900 |
| 12 | $7,500 | $8,400 | $7,000 | $7,800 | $6,900 | $6,700 | $6,100 | $6,400 | WR | $3,200 | $60,000 |
| 13 | $7,900 | $11,000 | $5,800 | $7,800 | $6,500 | $6,000 | $5,500 | $5,400 | RB | $3,700 | $59,600 |
| 14 | $7,700 | $7,800 | $7,300 | $8,600 | $6,100 | $5,600 | $6,700 | $5,400 | W | $4,300 | $59,500 |
| 15 | $8,200 | $8,500 | $7,400 | $7,500 | $6,400 | $5,400 | $6,700 | $6,200 | RB | $3,500 | $59,800 |
| 16 | $7,100 | $8,800 | $6,200 | $9,000 | $8,000 | $6,300 | $5,300 | $5,600 | RB | $3,600 | $59,900 |
| 17 | $8,000 | $8,800 | $7,300 | $7,200 | $6,500 | $5,900 | $6,400 | $6,400 | RB | $3,500 | $60,000 |
| AVG | $7,747 | $8,465 | $7,018 | $7,671 | $6,594 | $5,947 | $6,259 | $6,082 | $4,124 | $59,906 |
Click headers to sort.
The analysis of winning salaries will largely echo the themes mentioned when exploring ownership but there are still some specific takeaways to note. On a macro level, leaving significant salary on the table doesn’t seem to be a winning strategy—only two winning Sunday Million lineups left more than $200 unused and no winners left more than $500—over half of the winners used all $60,000.
Results could obviously be skewed if the overwhelming majority of users are using most of the salary by default—in other words, there may simply not be enough users experimenting with leaving substantial salary on the table to know if it can be a viable strategy.
Quarterbacks
As is the case with ownership, quarterback salaries in winning Millionaire lineups show that it’s not always necessary to target a top-end passer—paying all the way down, however, is rarely a winning strategy, assuming there are even starting min-priced options to begin with. Besides one lineup, $6,900 was the floor for quarterbacks on winning Sunday Million rosters, a salary that usually represents a quarterback in the QB15–QB20 range, depending on the week. The average salary of quarterbacks in winning lineups is a number that equates to about a QB10 price. Understanding that quarterback scoring is replaceable in fantasy should keep owners from getting locked into one strategy when rostering quarterbacks.
Running Backs
Considering how much top-tier backs dominated scoring last year, it’s not surprising that paying up for your RB1 was a winning roster move. In fact, it was usually wise to spend a good portion of your salary on two running backs. The average salary for the RB2s listed above represents a price range that is indicative of a player priced roughly in the RB10–RB12, depending on the week. This is a nod to how much FanDuel scoring favors high-volume backs over pass-catching specialists that might be viable on full-PPR sites. Of the four pass-catching positions that must be filled on FanDuel, only the average WR1 salary was higher than the average RB2.
Wide Receivers
A wide receiver at or above $8,000 on FanDuel usually meant that player was priced as a WR6 or higher but those elite-tier receivers were used just six times in winning Sunday Million lineups. With so much salary being spent on quarterbacks and running backs, it stands to reason that you can’t always pay up for one of those receivers but few winners were forcing an all-out stars-and-scrubs approach at wide receiver. The WR2 average salary suggests that the most common build in winning lineups was to pay for at least two top-24 receivers. This doesn’t mean to completely forego star power at the position—a balanced approach at the position was rare atop leaderboards as only three winners rostered three receivers priced above $6,500.
Tight Ends
With the pool of usable tight ends drying up, the option to punt the position and have success has diminished. Only four winners used a player at the position priced below $6,000, a threshold usually indicative of a player priced as a TE10 or higher—over a third of winners opted for a tight end priced in the top three that week. This tournament sample suggests that spending up for a tight end might be preferred over a WR3 or Flex in large fields.
Flex
Analyzing the flex can be a tricky proposition since it is comparing players across positions. For this study, though, the emphasis is on how salary is being allocated and Sunday Million winners typically spent more on the Flex than their WR3. This is a nod to the fact that running back made up the majority of the Flex spots and it was rarely a true punt play. Jamming in three studs wasn’t necessary with just two winning lineups rostering three backs priced at $7,000 or higher. Only one winner, however, didn’t roster a running back above $7,000, while just one other played no running backs or wide receivers above $7,500.
Defense
Defense saw a relatively smooth salary curve amongst winners. While ownership percentages show that the chalk hit at a relatively high rate, it wasn’t always necessary to spend all the way up at the position. When viable, defense is a position that winning DFS players have traditionally looked to punt but 2019 saw a disproportionate number of large spreads, leading to more usage on high-priced defenses. If there are fewer games with spreads of 10-plus points in 2020, the average salary and ownership numbers at the position could quickly fall.
Recap of Winning Trends
- FanDuel offers Beginner games that have notably lower cash lines and rake, both cash games and GPPs. Players who qualify, should prioritize these games over everything else.
- More experienced players should seek out single-entry contests over multi-entry games if they do not play enough volume to justify participating in head-to-heads. While owners that do prefer head-to-heads often won’t double their money in a week, there is evidence that the majority of small-stakes players are posting lineups well below the average of winning players.
- In general, the more players there are in a GPP, the lower the cash line but the higher the score needed to win. Players who cannot afford to max-enter multi-entry contests should often opt for smaller-field tournaments. As the field grows, owners should embrace rostering players with wider ranges of outcomes.
- Quarterback scoring is flat and replaceable. Balance your GPP portfolio with high-priced, popular plays and cheap, contrarian plays. The same stands for defense, although a shift may be coming for the latter if there are closer spreads in 2020.
- Be willing to pay up for multiple running backs, as FanDuel’s scoring system favors the position. Winning GPP players are often forcing a third mid-priced running back in the Flex.
- Winning GPP lineups rarely featured a wide receiver priced as a top-six option at the position but still often paid for at least two top-24 options. Top lineups often sacrificed their WR3 in favor of a more expensive tight end or Flex play.
- The shrinking pool of usable tight ends forced owners to spend up at the position, often for an elite option. If even a few players emerge as viable options early in the season, tight end could be an exploitable position before owners adjust.
- Running backs dominated the Flex spot in 2019 but owners may have overcompensated in their approach. Having some exposure to wide receivers as the Flex in GPPs could be unique enough to climb leaderboards.
- If you don’t cash a 50/50 or Double Up, you lose all of your money. A high-volume head-to-head player will see a return that’s roughly reflective of where their lineup falls on the point curve in a given week.
Footnotes
1. A rough bankroll principle to follow is to be able to play at least 30 games at a single buy-in level before switching to head-to-heads and, ultimately, moving up in stakes. A count of 30 is where any random sample should start to approach a normal distribution.


