Daily Fantasy Playbook 2015: Kicker Strategy

If “punters are people too” applies to real football, then “kickers are people too” applies to fantasy football. Many fantasy owners want kickers removed from fantasy lineups altogether, and many daily fantasy sites have obliged. However, kickers remain a requirement on certain sites – namely FanDuel. And as you’ll see when you read on, kickers are surprisingly one of the most predictable fantasy positions. Because many casual owners treat kickers as an afterthought, excelling in kicker selection can provide a useful edge. How do you go about selecting the best kicker?
Editors Note: If you open a new account with FanDuel with a minimum $10 deposit, you’ll receive a free one-year subscription to 4for4! Details here.
Field Goals
Roughly two-thirds of kicker scoring over the last two seasons has come from field goals. Additionally, field goal volume statistics – attempts and makes – correlate1 more strongly to fantasy points than field goal percentage. Emphasize field goal potential when selecting a daily fantasy kicker. Table 1 below shows the correlation coefficients of various statistics to kicker fantasy points per game.
| Correlation to Fantasy Points/ Game | |
|---|---|
| Field Goals Made | 0.86 |
| Field Goal Attempts | 0.73 |
| Team Offense Points Scored | 0.68 |
| Team Offense Drive Start | 0.58 |
| Field Goal Pct. | 0.56 |
| Extra Points Made | 0.52 |
| Team Offense Total Yards | 0.51 |
| Team Offense Passing YPA | 0.49 |
| Team Offensive Interceptions Thrown | -0.47 |
| Team Offensive Yards/Play | 0.45 |
| Team Offensive TO | -0.41 |
| Team Offense Rush TD | 0.41 |
| Team Offense Rush Yards | 0.39 |
| Defense QB Rating Allowed | -0.36 |
| Offensive Comp % | 0.36 |
| Team Offense Pass Yards | 0.30 |
| Defense Interceptions | 0.22 |
| Defense Sacks | 0.21 |
| Team Offense Rushing Yards/ Attempt | 0.13 |
Kickers have made 85 percent of their field goals over the past two seasons, and with that in mind, it’s easy to see why kicking opportunities are worth so much: even a poor kicker will make roughly three out of four.
The challenge with trying to gauge a kicker’s accuracy is that it can take years for kickers to compile a large enough sample size of attempts to accurately judge their accuracy – kickers generally attempt between 20-40 field goals in a season. Last year, I looked at all kickers from 2008-2013 who finished in the top-32 in field goal attempts in any two consecutive seasons within that time frame to see if there was any correlation between their accuracy from one year (year y) to the next (year y + 1). I found that less than one percent of field goal percentage in year y + 1 was explained by field goal percentage in year y. The results improved to 44 percent of variance explained when looking at a kicker’s accuracy in a given season compared to his career percentage. If choosing between kicking options projected for similar volume, look at a kicker’s career numbers to get the best read on his accuracy.
Caution should be taken with kickers who have had recent accuracy struggles, which may potentially indicate an unreported injury. Furthermore, sometimes teams with struggling kickers eschew field goal attempts in favor of going for it on fourth down, naturally torpedoing that kicker’s value.
Game Script
Game script is the most important factor when determining how many opportunities a kicker will get. When a kicker’s team has the advantage in a given game, the team will likely have better field position and a shorter field necessary to get into field goal range – Table 1 showed that a kicker’s fantasy point totals have a moderately strong correlation to his team’s actual points. In addition, the team with the advantage in a given game is more likely to build a lead and thus is less likely to be forced to forgo field goals in favor of trying to catch up with touchdowns. Table 2 below shows the disparity between how often teams attempt field goals on fourth down inside the 35-yard line when ahead or tied compared to when trailing.
| Field Goal Attempt % | |
|---|---|
| Leading or Tied | 87.5% |
| Trailing | 69.5% |
Vegas lines are accurate enough to project game script, and ultimately kicker production. Combining a game’s Vegas point spread and over/under yields the amount of points that Vegas projects each team to score. As you'll see below, the more points Vegas has projected a team to score, the more points you can expect that team’s kicker to score (Table 3).
| Vegas Projected Points >= | Vegas Projected Points < | Kicker Points | Games |
|---|---|---|---|
| 0 | 17 | 5.94 | 47 |
| 17 | 20 | 6.79 | 179 |
| 20 | 23 | 7.04 | 297 |
| 23 | 26 | 7.57 | 272 |
| 26 | 29 | 8.08 | 170 |
| 29 | 30+ | 9.17 | 59 |
Vegas’ accuracy is remarkable, and should be the pillar of your kicker selection process.
Since you’re seeking offensive production from your kicker’s team, it will often make sense to target kickers on teams with good quarterbacks, or on teams facing poor passing defenses. Responsible for moving their offense down field, quarterbacks will be the main catalyst in getting a kicker scoring opportunities throughout a game. 4for4’s Law of Averages: O vs. D report is also useful – it averages an offense’s field goals with the opponent’s to give a sense of a kicker’s scoring potential in a given game.
Home/Road Splits
The home field advantage present in the NFL results in a slight increase in kicker scoring at home, as shown in Table 4.
| Home | Road | % Difference | |
|---|---|---|---|
| Field Goal Attempts | 1.98 | 1.9 | 4.4% |
| Field Goal Percentage | 85.4% | 85.1% | 0.4% |
| Extra Points Made | 2.6 | 2.25 | 15.4% |
Consistency
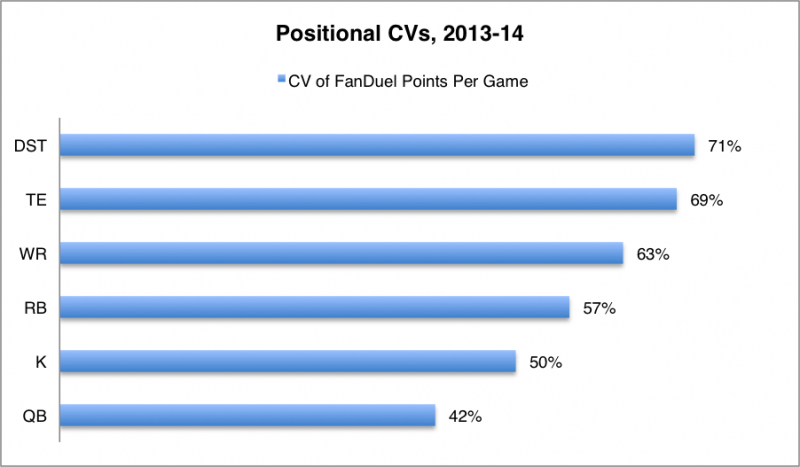
Despite the narrative that kicker scoring is random and unpredictable, kickers exhibit a high amount of weekly consistency. You might recall that consistent fantasy performers are ideal for maximizing your floor in cash games, while volatile players help boost your ceiling in tournaments. The average kicker scores 50 percent more or 50 percent less than their actual seasonal mean fantasy points per game – the only position more consistent is quarterback. You may be aware that the aforementioned 50 percent figure is called the coefficient of variation (CV) – the standard deviation in weekly fantasy points divided by the mean of weekly fantasy points. The average CV for each position is summarized in Figure 1 below. The shorter the bar, the more consistent the position is.
Figure 1
You’ll often end up with a certain budget for your kicker and defense/special teams positions combined since they are similarly priced. Because kickers are relatively consistent, you shouldn't automatically choose the cheapest kicker possible in a cash game – unless that kicker is the best value, of course. Kickers are relatively cheap regardless, but spending a few hundred extra dollars could leverage their consistency into a higher floor for your cash game lineup. This intuitively makes sense, as kickers have higher floors than defense/special teams because they cannot score negative points.
Tournaments are the type of contest to prioritize defense/special teams over kicker. Defense/special teams have higher ceilings than kickers because they can score touchdowns while kickers cannot. To illustrate, the ten highest FanDuel scores from kickers are compared to the ten highest from defense/special teams in 2014 in below (Fig. 2).
Figure 2
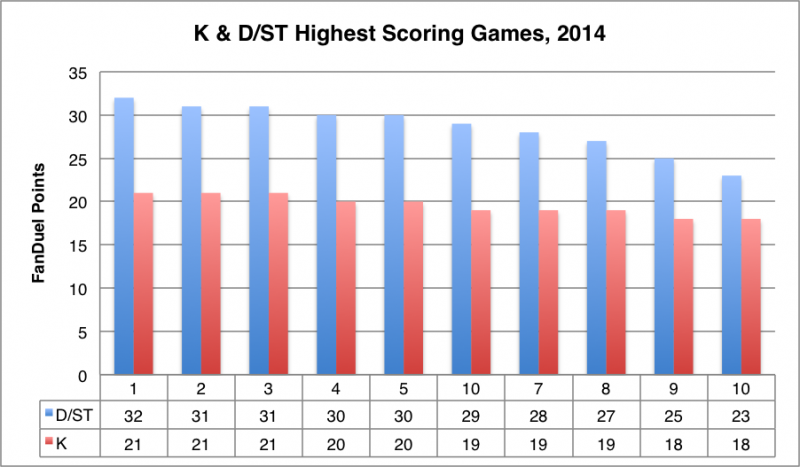
The top ten kicker games averaged only 19.6 FanDuel points, compared to 28.6 FanDuel points for the top ten defense/special teams. What’s more, that group of kickers cost $300 more on average than the group of defense/special teams. That calculates to the top ten kickers returning an average value of 3.89x, which pales in comparison to the defense/special teams mark of 5.72x.
Weather
It is best not to select kickers facing extreme weather conditions, such as 15-plus mile-per-hour winds or heavy snow. All other things being equal, a kicker has an advantage in warmer weather because the ball will travel farther when kicked. Keep this in mind especially when looking for 50-plus-yard field goal upside in tournaments. It’s worth noting that adverse weather effects will almost always be taken into account in Vegas lines as kickoff approaches.
Summary
- Emphasize field goals over extra points
- Emphasize field goal volume over field goal accuracy.
- Positive game script is critical for kickers – teams are much more likely to attempt field goals when leading than when trailing.
- Vegas should be the backbone of your kicker selection process – the more points Vegas projects for a team, the more points their kicker is likely to score.
- Kickers are one of the most consistent positions – they have higher floors and lower ceilings than defense/special teams.
Editors Note: Liked this article? You can check out the entire Daily Fantasy Playbook 2015 series here (Links will be updated as they become available): QB, RB, WR, TE, K, D/ST
1. A quick refresher on correlation coefficients: The scale is -1 to 1. Positive values indicate variables move in the same direction, while negative values indicate variables move in opposite directions. An absolute value of 1 means perfect correlation. Absolute values above 0.7 are considered strong, those between 0.3 and 0.7 are moderate, and those under 0.3 are weak.


