2021 U.S. Open: True Test Awaits at Torrey Pines

The 121st edition of the United States Open is finally here. Each major championship has its own unique characteristics and the U.S. Open is no different. Lengthy courses, ultra-deep rough, and firm, fast greens are the norm. This year, along the cliffs of the Pacific Ocean, the Torrey Pines South course will follow that same formula.
Course Preview
One of the most prevailing features of Torrey Pines is its length. This is true even at the PGA’s annual Farmers Insurance Open tournament which is held every year (at both the South and North course). For this year’s Open, however, the United States Golf Association (USGA) has turned the 515-yard sixth hole from a par-5 into a par-4. This transforms Torrey Pines into a Par-71 course measuring out at 7,685 yards. That equates to 108.2 yards per stroke, making it the longest course on Tour and in major history.
Another trademark of Torrey Pines is its difficulty. The South course annually scores as one of the five toughest courses in the PGA Tour’s rotation. This year at the Farmers Insurance tournament in January, it ranked as the third toughest course at 1.34 strokes over par. Add in the predicted narrow fairways, five-inch Kikuyu rough, and increased speed and firmness of the greens, and you have a grueling test for the 156-player field, of which only the top 60 and ties will make the cut.
With the three easiest holes being the par-5s (each with a birdie % over 30%), players will need to take advantage of those holes. The only issue is that two of them measure over 600 yards and can be tough to reach in two shots. The par-4s are some of the most difficult holes at Torrey Pines and average well over 4.2 strokes per hole over the past five years. Depending on the yardage for each round, approximately seven holes will be in the 450-500 yard range, with three other par-4s playing over 500 yards! Throw in the thick marine layer, (also known as "June Gloom"), which will only hamper distance on shots, and hopefully, you get the picture that this might be a test of survival.
A final intriguing course feature is the Poa Annua greens. This grass type is known as the least consistent putting surface due to its fast-growing nature throughout the day which can result in “bumpy” putts for players with afternoon tee times. Many players are known to despise it, but those who grew up playing on Poa, especially near the West coast, have become “Poa specialists”, and are players to be targeted.
U.S. Open Model Splits
Each tournament I’ll take you through my modeling process, which will also give a detailed analysis of the most important stats and splits for the week. My modeling is built around the PGA’s relatively new Strokes Gained data, which is divided into SG: Off the Tee (OTT), SG: Approach (APP), SG: Around the Green (ARG) and SG: Putting (P). Learn more about Strokes Gained and why it can be so useful in analyzing the past and predicting future performance. Each individual model will be posted on my Twitter feed, with the final model being exclusively published here. For this first article, I will explain some of the different stats and why they are included in each individual model. Let’s get started!
Split #1 - SG: OTT Model
The OTT model this week is very important. There are two reasons for this. First, with Torrey Pines being the longest course on the PGA Tour, driving distance will be paramount. Secondly, the Driving Accuracy % over the past five years is only 52.9%, making it one of the five toughest courses on Tour in which to hit the fairway. The model takes into account six different splits: Adjusted (ADJ) SG: OTT over the last 20 rounds, Driving Distance over the last six months, Total Driving (which gives equal weight to distance and accuracy), Good Drive % from other courses with difficult to hit fairways (going back to 2018), SG: Total on those same courses and the percentage of rounds a player has gained strokes OTT over the past six months.
Split #2 - SG: APP Model
Almost every week, SG: APP will be the most important metric to consider when placing your hard-earned money on a player. The reason it’s so important is that it is the most predictive golf stat of future performance. With the greens at Torrey Pines being very firm and small (5,000 square feet), players who can accurately hit their long irons from 175+ yards will have a distinct advantage. The model for this week includes ADJ SG: APP over the last 20 rounds, SG: APP on other tough-to-hit Greens in Regulation (GIR) over the past three years, Proximity to the hole from 175+ yards over the last six months, Proximity from 175+ yards on tough GIR courses since 2019, and my favorite, Proximity from the rough on other courses with at least three-inch rough.
Split #3 - SG: ARG Model
Scrambling is one of the most important stats to analyze, especially on U.S Open-type courses with tough greens and long rough. Whether hitting from the sand or rough, being able to get up and down on Torrey’s fast Poa greens is not anything to be taken lightly. As is the case for most majors, Scrambling, Sand Saves and SG: ARG will go a long way in determining the winner. This model takes each of those into account and also uncovers those players that perform well on other “Tough Scrambling” courses.
Split #4 - SG: P Model
As previously mentioned, putting on poa greens presents a challenge to many players. Those such as Louis Oosthuizen and Jon Rahm have seemingly mastered it over the years and are at the very top of this model. Another feature of this article each week will be showing which players putt above their baseline on the specific grass for each tournament. Some players might not be “good” on a certain grass, but they still might be a good play if they putt above their baseline. Three other important splits included this week are putting on “Fast” greens, average from 5-10 feet, and 3-putt avoidance.
Split #5 - T2G Model
The T2G (tee-to-green) split simply combines SG: OTT, SG: APP, and SG: ARG into one basic stat. It is very useful to determine which players are performing the best at the moment because it eliminates the noise that putting can often bring.
Split #6 - Course History Model
Utilizing previous course history for modeling purposes is somewhat of a controversial topic. Some claim it has no effect on future performance. I am in the opposite boat, and will definitely use it, but only to an extent. Also, some courses are more predictive than others. So the amount I use it in my modeling usually varies from week to week.
Split #7 - Long and Difficult Course Model
The Torrey Pines South course has the grueling combination of being both the longest course in major history (by par stroke) and perhaps the most difficult. When combining these factors, this split shows how players have performed on other "Long and Difficult" courses.
Split #8 - Majors and Strong Fields Model
It’s always interesting to remove all the average and weak-field events and solely focus on how players have performed in other "Strong Field" events. These rounds only include majors, WGC events, FedExCup events and the Players Championship.
Split #9 - West Coast Model
Believe it or not, some players do tend to play better in specific regions of the country. It could be related to where they grew up, or just being comfortable with a certain grass type that is prevalent in that location.
Split #10 - Scoring Model
Each week I will include a “Scoring” model which will incorporate the most important scoring statistics for that particular tournament. Some examples from this week are BoB% (the % a player scores birdie or better on a hole), Opportunities Gained (a stat from Fantasy National which measures scoring opportunities from 15 feet or closer), and par-5 scoring. We want to bet on players who have scoring upside to win the tournament.
Split #11 - Safety Model
The flipside of the “Scoring” model is the “Safety” model. Just as the “Scoring” model shows the ceiling of a player’s ability, the “Safety” model presents us with his “floor”. Players who rate high in this model don’t typically win many tournaments, but they make cuts and are usually consistent from one week to the next. This model combines a host of “survival” metrics such as Bogey Avoidance, Scrambling, and Fairways Gained. The beauty of the “Scoring” and “Safety” models is finding those players for the week who rate high in both.
Split #12 - Core 4 Model
The final model I will utilize is called the “Core 4” model. The goal is to boil down the tournament to the four most important stats for determining the winner.
Before we get to the final model, here’s one last piece of advice. Never blindly follow anyone’s model or predictions. Learn how to do your own research and get to know the players and their tendencies as much as possible. Have the confidence to make your own adjustments. Let me give you a perfect example of this. Last week, at the Palmetto Championship, Doc Redman finished 55th in my model. Keep in mind that this tournament had an extremely weak player field. Just months ago, Doc Redman was one of the up-and-coming stars on Tour. He was also playing in his home state and had made the cut in his three previous tournaments. So even though the model didn’t like Redman’s chances of competing last week, common sense told me that these other intangibles made him worth a play. He ended up finishing second in the tournament and being a very productive selection.
Final U.S. Open Model
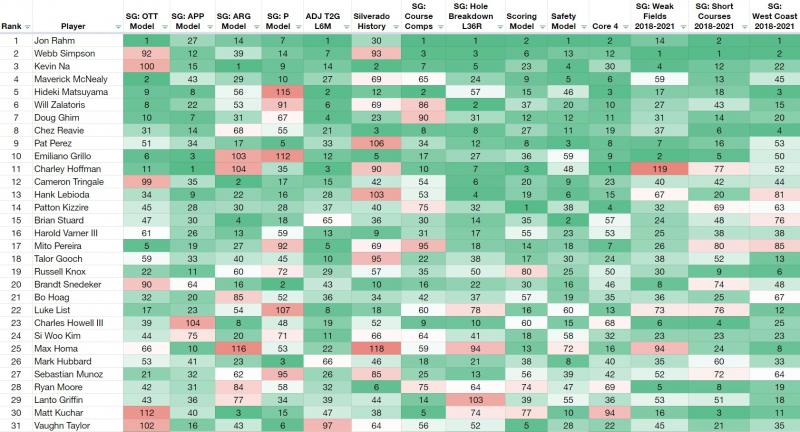
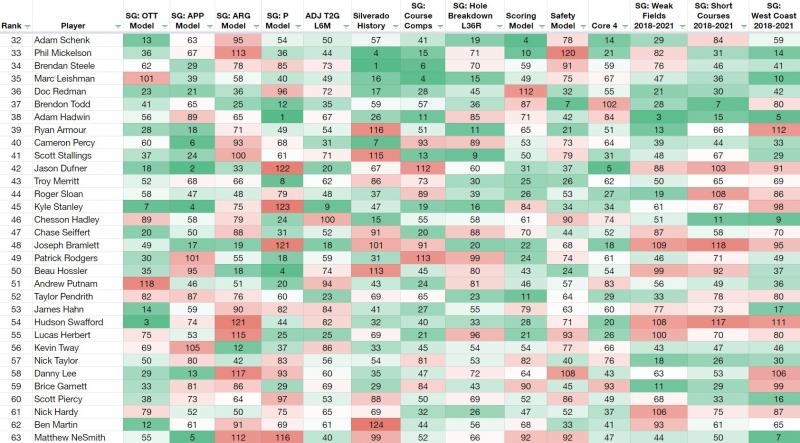
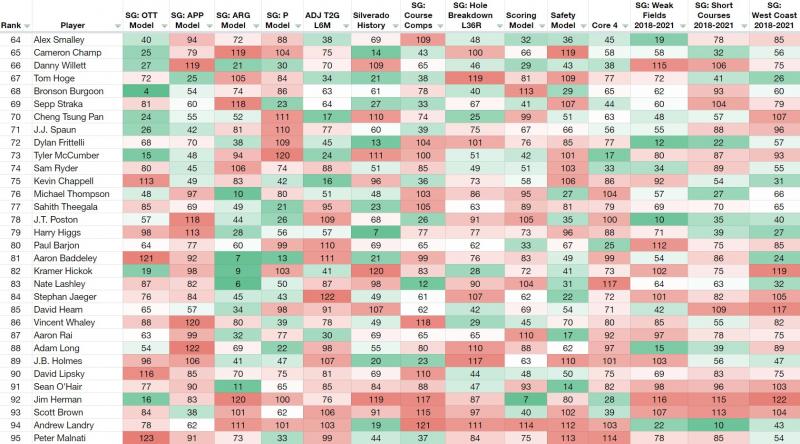
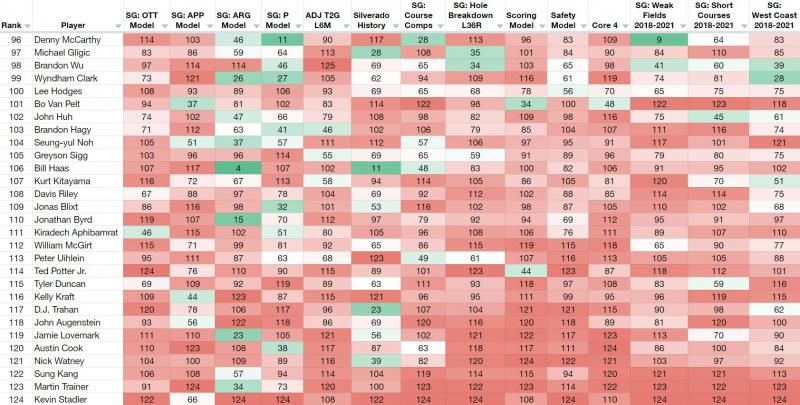
Note: Only players with enough data points (i.e measurable rounds played) are used in the model.
Outright Betting Selections
*Betting lines accurate at the time of publication.
Top Tier
With my first selection, I’m going with the top player in my model (which I will always do, #TrustTheProcess) in Jon Rahm at +1050 (DraftKings). He ranks first in the all-important OTT, has great course history at Torrey and is near (or at the top) in almost every one of my splits. My next choice will be a player who I’m convinced should just be an “auto-bet” at every major tournament. Yes, I’m speaking of Mr. Major himself, Brooks Koepka. Current form seemingly means nothing when it comes to his top-level performance in majors. At +1900 (DraftKings), sign me up!
Mid-Tier
As we go a bit further down the board, Patrick Cantlay really sticks out to me at +2500 (FanDuel). He’s third in the model, yet is 12th in the betting ranking. He always tends to play very well in his home state of California (No. 3 in my West Coast model), is in the top 10 in six of my splits and is coming off a win at the Memorial tournament a couple of weeks ago. I also love Will Zalatoris this week at +4650 (DraftKings). Coming off a second-place finish at the Masters and an eighth-place finish at the PGA Championship, the smooth swinging lefty is primed for his first victory. While the short game is his only real weakness, his best putting splits are on Poa. One of the best iron players in the world, he also has the distance to attack each hole.
Longshot
My longshot for the week is Carlos Ortiz at +17000 (FanDuel). Ranking 35th in my model, he has the ability to power the ball off the tee, along with an elite short game. The most enticing thing about him right now is the 16.2 strokes gained on approach over the last four events. He finished 29th here a few months ago at the Farmers Insurance.
Finishing Positions
-
Xander Schauffele Top-10, +175 (William Hill) - Ranks second in the Model. Has finished fifth, third, sixth and fifth in his last four U.S. Open appearances.
-
Tony Finau Top-10, +205 (PointsBet) - Has finished in the top 10 in five of the past six majors. Ranks seventh in the weekly model.
-
Will Zalatoris Top-20, +163 (DraftKings) - Doubling up with Willy Z. He already has seven top-20 finishes this year.
-
Louis Oosthuizen Top-20, +175 (PointsBet) - “Oosty” always seems to be sniffing the front page of the leaderboard when it’s major season. He’s the best Poa putter in the field and is also No. 1 in the “Safety” model
-
Jason Kokrak Top 20, +250 (PointsBet) - Even after winning the Schwab Challenge and finishing in the top 10 in three other events this year, Kokrak gets very little respect. He ranks 11th in my model, second in OTT and ranks eighth in “Scoring”.
Matchups/Props
-
Joaquin Niemann +115 (DraftKings) Round 1 3-ball over Garrick Higgo and Cole Hammer - Over the past year, Niemann, the 31st-ranked player in the world, is gaining strokes on the field in the first round 71% of the time. Higgo is coming off a high at his first PGA Tour victory at Palmetto, while Hammer is an amateur who is not expected to make any noise.
-
Max Homa +120 (DraftKings) Round 1 Matchup over Phil Mickelson - This one is quite simply a matter of valuation. I believe Mickelson is overvalued after his surprising win at the PGA Championship, while Homa is severely undervalued, as he has five top-10 finishes in the past four months. Over the past year, Homa (+0.6) is also gaining (on average) an entire stroke on Mickelson (-0.4) in the first round of tournaments.
Starting next week, my final model, along with other analysis and betting selections will only be available at 4for4. You can use the coupon PGASPLITS to receive 25% off the yearly betting subscription. This deal will end on the Sunday of the U.S. Open, June 20th.
For the most up-to-date picks check out my Twitter and subscribe to our Discord. This sheet from Dan Rivera tracks all my betting picks (and those from the rest of the betting staff) on the year. Just click on the tab with my name on it for the results.
This article is intended for entertainment purposes and adult users only. Call 1-800-GAMBLER if you have a gambling problem.