Optimal MFL10 Roster Construction: Part 2

Thank you to Mike Margossian for co-authoring and compiling the data used in this article. Follow Mike on Twitter: @MikeMarFF.
As we discussed in Part One, studying past data is absolutely worthwhile. However, one of the biggest problems with NFL analysis is often a lack of sample size.
Although the “optimal” way to win an MFL10 in 2016 could easily differ in 2017, there still could be a ton of value in using 2016 data to lead us in a favorable direction.
The data for this 2016 study consists of 66,600 teams constructed across 5,550 drafts for MFL10s up to MFL100s. To break even, a person needs to win about 9.5% of their drafts (including equity for 2nd place finishes or even 3rd place for the higher buy-in drafts).
Let’s dig back into last year’s data — but more importantly draw some conclusions as to what actionable information we can leverage from 2016. Also, does optimal roster construction differ for traditional MFL10 leagues versus the new version of best ball leagues known as 50/50s?
Which Strategies Should Have Been Used More?
In Part One, we discussed the most popular MFL10 lineup constructions as well as the most common first place strategies — but which strategy was most underutilized?
Here's a recap comparing the most common roster constructions to how many winning teams implemented each strategy:
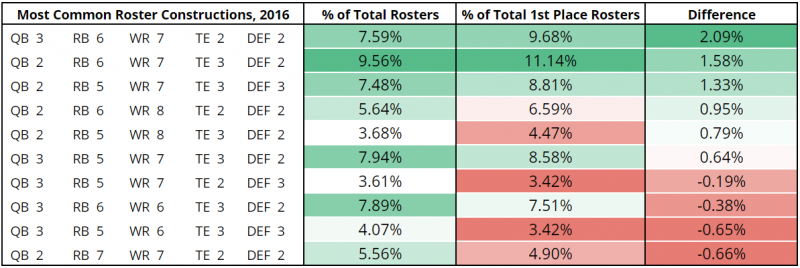
Note that small differences may be more significant than they seem on the surface.
For example, QB3/RB6/WR7/TE2/DEF2 accounted for 7.59 percent of the total MFL10 rosters — or 5,054 of the entire 66,600-team sample -- but 9.68 percent of the 5,550 first-place rosters (or 537 teams) employed the QB3/RB6/WR7/TE2/DEF2 strategy.
A 2.09-percent difference in first-place usage versus overall usage is probably not insignificant, especially when we consider that the QB3/RB6/WR7/TE2/DEF2 makeup won 10.6 percent of the time that it was used -- only 2QB/4RB/8WR/3TE/3DEF won more often (10.8-percent win rate, minimum 50 samples).
Outside of the most popular QB2/RB6/WR7/TE3/DEF2 strategy (which was probably still underutilized), it seems that of the more popular strategies, both QB2/RB5/WR7/TE3/DEF3 and QB3/RB5/WR7/TE3/DEF2 were also underutilized when we consider how many winning teams used the strategy compared to how often each was actually implemented.
In contrast, QB3/RB6/WR6/TE3/DEF2 was probably the most overused when examining just the top five most popular lineup constructions.
Of rosters that were used less than six percent of the time overall, but still in the top-10 in popularity, there may be an edge in going heavy at WR. Both QB2/RB6/WR8/TE2/DEF2 and QB2/RB5/WR8/TE3/DEF2 overperformed relative to their popularity. This is what stands out most from the data.
Again, sample size can skew almost anything, including our perception of what is optimal in examining these results.
For example, using a DFS lens, say 80 percent of Millionaire Maker winners implored a QB-WR1 stack. Now, QB-WR1 is probably more optimal than something like QB-RB-RB, but it is also tough to be sure because a much larger sample size of people used QB-WR (read - more darts were thrown).
If you take one thing from this article, realize that small sample sizes can still be representative, especially when examining an alternate strategy like drafting eight WRs in an MFL10.
What if we had 50/50 MFL10s in 2016?
For the 2017 season, MFL will be introducing a new version of best ball leagues known as 50/50s. While the league structure and rules mirrors that of a traditional MFL10, at the end of the season the top six teams win a prize.
The following chart displays the 20 most popular roster construction strategies of teams that would have finished in the top six in 2016 compared to how often each strategy was used overall:
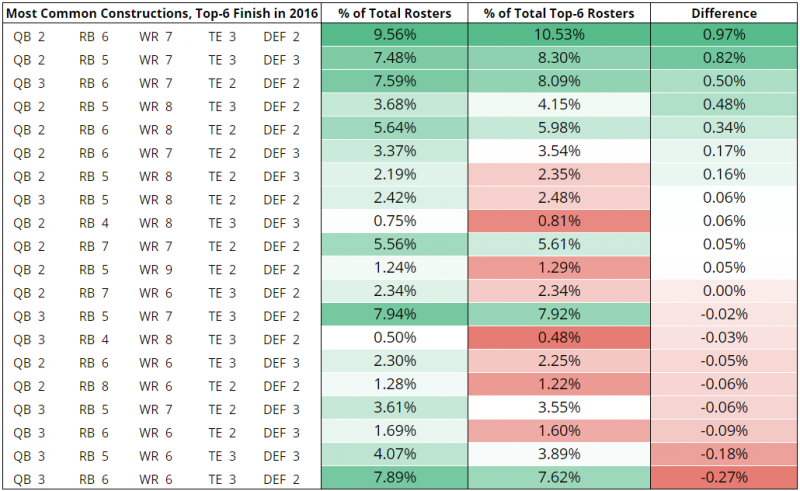
The most popular strategy overall -- QB2/RB6/WR7/TE3/DEF2 -- still looks to be most underutilized, followed by QB2/RB5/WR7/TE3/DEF3 in 50/50 contests.
Similar to first-place rosters, drafting eight WRs would have been an undervalued strategy in 50/50s. On the other hand, QB3/RB6/WR6/TE3/DEF2 is one the worst ways to go, yet again, in regards to the difference in popularity versus finishing in the top half.
Drafting 3 QBs and 3 DEF looks suboptimal, but intuitively that makes sense because that leaves you with just 14 roster spots to spread across WR, RB, and TE.
It’s tough to judge the viability of a contrarian approach such as drafting 8 RBs or even 9 WRs in 50/50s. The sample size is small, but the results are also not terrible relative to their popularity.
Raising your floor this year for these contests will be extremely important — there is probably an argument for locking down as many RBs and WRs as you can.
The Bottom Line
-
The “optimal” way to win an MFL10 in 2016 could easily differ in 2017.
-
Most popular, or even highest win rate, does not necessarily mean “optimal”. It’s all relative to sample size.
-
Drafting 8 WRs is probably underutilized relative to its popularity and success rate.
-
Drafting 3 QBs and 3 DEFs on the same roster is not worth the lost roster slot for WRs, RBs, and TEs.
- Small samples can still be representative, especially with formerly contrarian strategies that likely increase your floor (especially in 50/50s).
Editor's Note: Subscribe now and get an an early-bird discount on 4for4's 2017 Classic, Pro, or DFS products!
Related Articles
- Optimal MFL10 Roster Construction: Lessons Learned in 2016
- Who to Target in MFL10s Before the NFL Draft
- The Underrated Fantasy Impact of Kenny Britt to the Browns
- How Will DeSean Jackson Impact the Buccaneers Offense?
- Are the Eagles Ready to Soar with Alshon Jeffery and Torrey Smith?
- Is Brandon Marshall Done?
- An Intro to MFL10 Draft-Only Leagues: Prizes, Rules & Basic Strategy
Listen to the Most Accurate Podcast's Big Free Agency Pod with John Paulsen: