Are Early Round Receivers Safer Than Running Backs?

Draft strategy is something I ponder every offseason. I typically use a Value-Based Drafting (VBD) philosophy, which ultimately ranks each player relative to his position and allows us to rank players across multiple positions. But I like to think of myself as open-minded, so I’m more than willing to research other strategies. Last summer, there was a lot of discussion about Zero RB which emphasizes the lack of dependability (due to injury, poor performance, etc.) in the running back ranks as the main reason to draft other positions – usually wide receivers – in the first few rounds. This is the latest incarnation of the Upside Down Drafting strategy, which I’ve read about in multiple places over the years. (Credit to whomever first wrote about it – my familiarity stems from Matt Waldman’s work with the subject, but he’s usually quick to point out that he didn’t invent the strategy, either.) For the purposes of this article, I'll simply refer to it as a Wait on RB strategy.
For a typical PPR league, our preseason draft rankings will usually have several running backs, a few wide receivers and possibly a tight end in the top 12. We generate these rankings using our award-winning projections, and each player’s Relative Value (another term for Value Based Drafting), which is derived from our own baselines for each position.
While I continue to have success in my own leagues with our current setup, I’m always intrigued with the possibility of using a different philosophy to inform or improve my draft strategy. One thing I really wanted to study this offseason was the concept of positional dependability, because that’s really the crux of a Wait on RB philosophy: Running backs aren’t as dependable as receivers so don’t draft them early. The turnover at the position will allow for middle- and late-round running backs to emerge as viable fantasy starters as the season wears on, so fantasy owners can cobble together production at the position while enjoying reliable workload and production from two or more stud receivers drafted in the early rounds.
Methodology
In order to quantify a position’s dependability, I compiled average draft position (ADP), fantasy points (for PPR formats) and actual relative value (RV) data from the last 10 seasons for each RB/WR draft slot through the top 60. I took the ADP data from MyFantasyLeague 12-team PPR redraft leagues that were started after August 15 in any given year.
So, I now know the average fantasy points the #1 drafted RB has scored over the last 10 years (303.6), the average pick used (1.018) and the average percent return (%R) when compared to the actual top RB from each season (79.6%). The idea is to use %R as a way to compare early-round running backs and wide receivers.
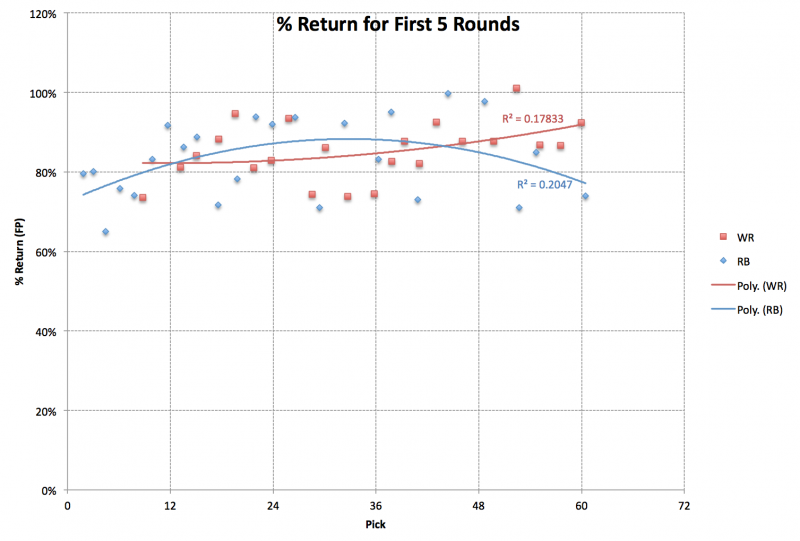
Since draft strategies focus on the first few rounds, the above chart shows how each position fares in the first five rounds. Notice that the first two RBs taken have, on average, fared better than the next three backs off the board. Then the running backs going around the turn (the next four blue data points) do quite well in comparison.
The #1 receiver has performed about as well as the #3-#5 RBs, but the position fares even better as we get into the #2-#8 WR range. When looking at all of the players drafted in the first two rounds, 13 RBs have averaged an 81.6% return, while seven receivers have averaged 83.7%.
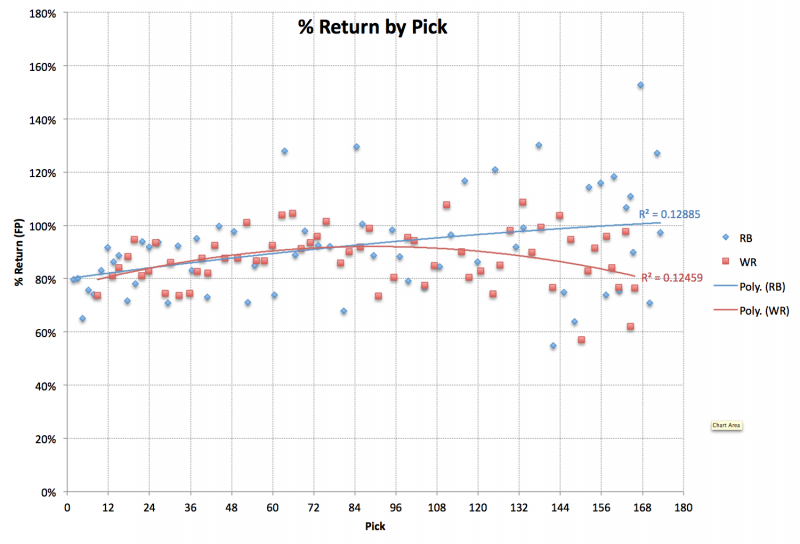
This is essentially the same graph, but it includes all of the data I collected. I included it here to point out that running backs that go in the later rounds (Round 8/9 and later) tend to provide a higher return than their WR counterparts. Using pick #84 as the cutoff, late-round RBs have averaged a 97.8% return, while WRs have averaged 87.1%. This would seem to support the idea that owners can find functional running backs in the later rounds.
Note: Keep in mind that actual fantasy points scored fall off at a much faster rate at running back than they do at receiver, so it’s easier for later running back picks to provide a higher return while it's easier to find a receiver who will "put up some points" in PPR formats.
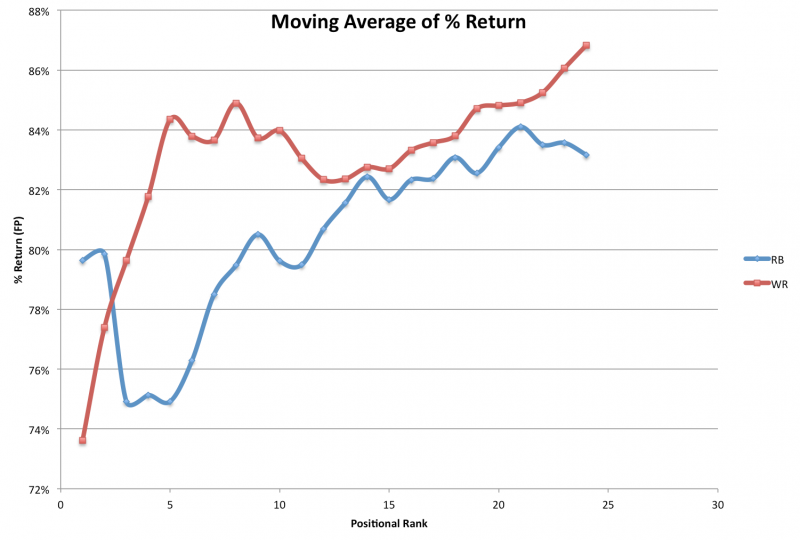
The above graph further illustrates how the %R changes as we move down the positional ranks. Again, the top two (drafted) running backs tend to fare well, but once we get into the meat of the 1st round, the WR position tends to become more dependable. The moving averages start to converge once we’re through the top 10 at each position.
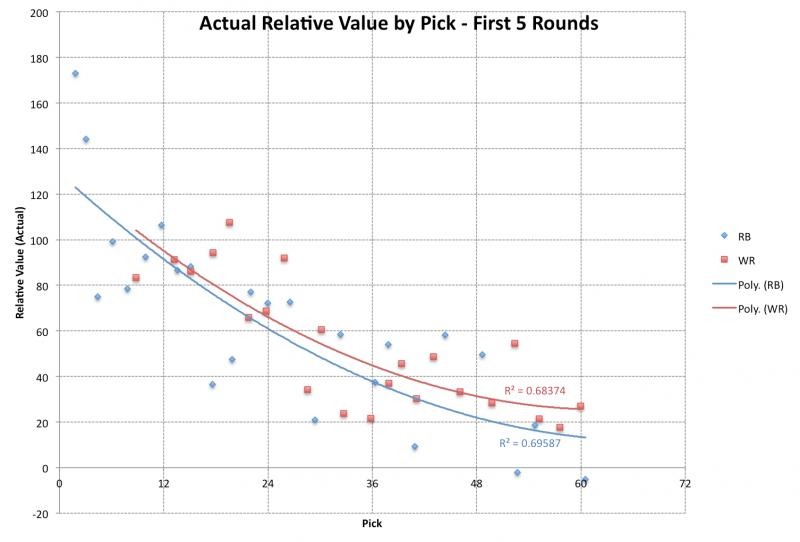
A player’s relative value (RV) is one of 4for4’s main ways to rank players across multiple positions. The graph above shows year-end RV for each position through the first five rounds. To calculate RV, I simply found the difference between a pick’s actual points scored and the points scored by the #36 player at his position (i.e. the position’s baseline). Averaging 10 years of actual relative value resulted in the above graph.
Again, the top two drafted RBs tend to do well. So far, I haven’t seen much evidence to convince me not to draft one of the top two running backs in any given season.
The first two rounds encompass the next 18 players. Five of the next seven receivers offer RV at or above their trendline, while just five of 11 running backs can say the same. (The fact that the red trendline is above the blue trendline is also noteworthy.) Notice that the running backs taken around the turn tend to do better relative to their draft position than those backs taken in the middle of the 1st round.
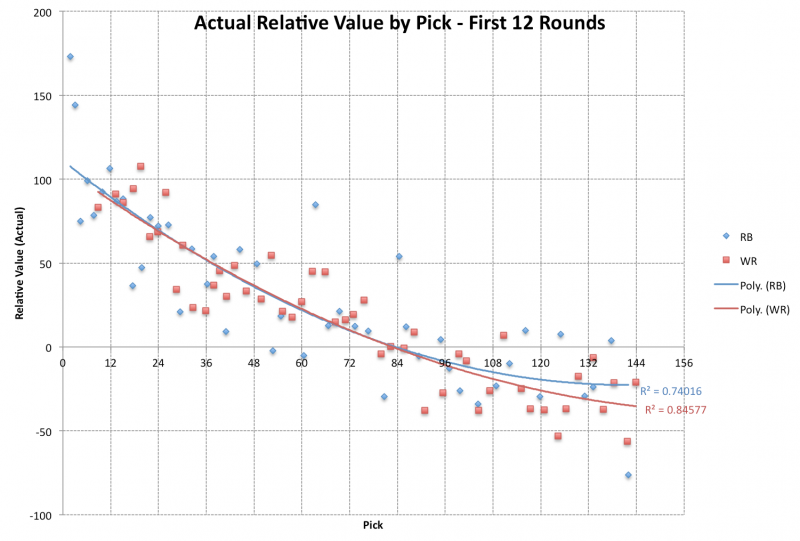
The above graph shows actual, year-end RV for the first 12 rounds. Notice how close the trendlines are for the first seven rounds before starting to diverge in Round 8. This indicates that, as a whole, the running back position offers more RV than the receiver position in the later rounds (8th-12th) of the draft.
Remember, we’re using a baseline of #36 for both positions, and if this is altered for either or both positions, it will impact the value of each position relative to the other.
For example, if your league starts two running backs and three receivers, you could use a last starter baseline of #24 for RBs and #36 for WRs, which would further enhance the appeal of drafting receivers in the 1st or 2nd round. Here’s the “First Five” graph for such a scenario:
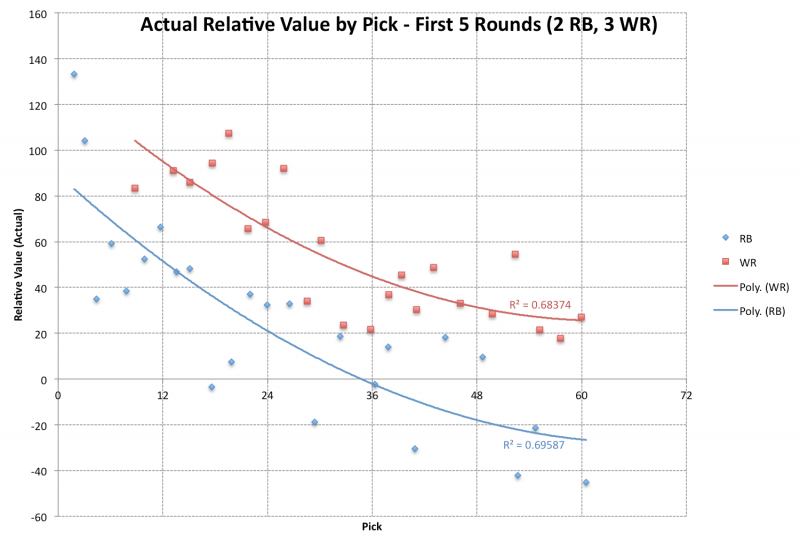
As you can see, the entire receiver position gets an upgrade over the running back position when the baselines are altered for 2RB/3WR starting lineups, making it even more logical to draft a receiver or two in the first two rounds.
Conclusion
This was an informative exercise. After running all the numbers, I found that the receiver position is indeed more dependable than the running back position, especially after the first couple of backs are off the board.
Will this change my approach in PPR formats? Yes, I’m now more willing to draft a receiver in the first round, as long as a no-brainer top 2 RB pick isn’t available. I’ll probably still draft at least one running back by the end of the 4th round, because it would be too nerveracking to go into the season without at least one RB with an established or attractive role/workload. Even so, I’m interested to see how a Wait on RB philosophy works in real life over multiple leagues. I’d be even more inclined to start a draft WR/WR if it’s a 2RB/3WR league (as in the earlier example), since the changing baselines now favor the receiver position.
However, I’m not going to go into draft season with any strategy set in stone. My willingness to wait on the running back position will depend largely on how confident I am in the backs that are available in the 4th-6th rounds. Without a few appealing targets in the middle rounds, I’ll probably end up drafting at least one RB early.