Which 2018 Fantasy Football Trends are Here to Stay in 2019?

As we start to turn the page toward the 2019 NFL season, it’s important to take a look back at what happened during 2018.
Quite a few noteworthy things happened.
- 1. Tom Brady and the Patriots collected the sixth Infinity Stone.
- 2. The world was invited to witness the greatness of one, Patrick Mahomes.
- 3. Saquon Barkley leaped to the dynasty RB1 overnight.
But let’s take a step back from the individual accomplishments for a moment.
Instead, let’s take a zoomed-out view of just what happened during the 2018 season and try to decipher if the chaos of the 2018 season was just an abnormality, or when looked upon more closely, a trend that’s been growing consistently over the past few years.
Let’s start from a 35,000-foot view and look at the league’s progress as a whole, starting with total play volume.
Is Play Volume on the Rise?
Here we can see whether or not the National Football League is trending up or down in terms of the sheer number of plays being run.
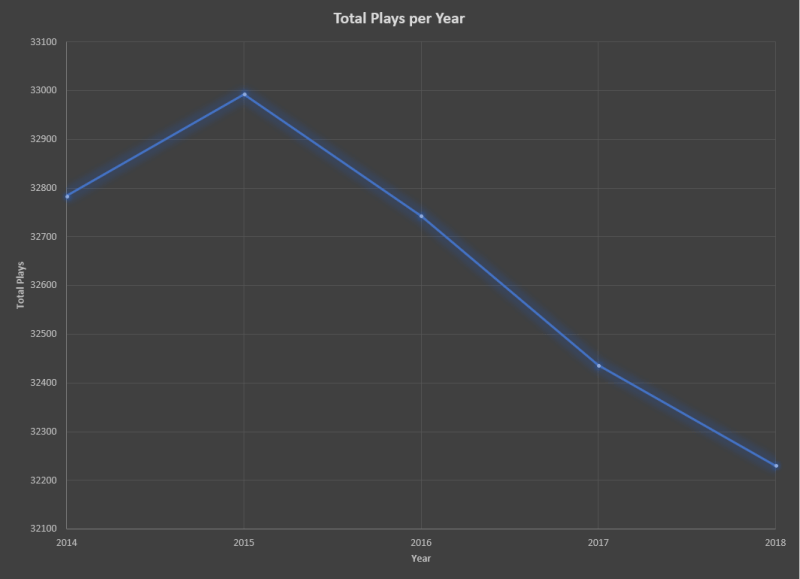
After a spike in 2015, we’ve seen three consecutive years where play volume has been on the decline.
Is this possible due to a decrease in the pace of play?
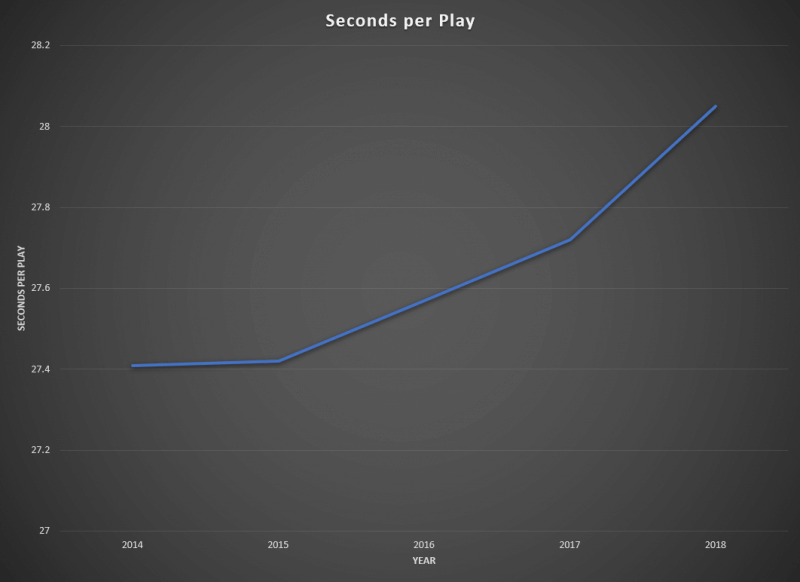
Over the past five seasons, we’ve seen teams consistently take longer to snap the ball. From getting the play call into the quarterback’s headset to making the necessary blocking adjustments and pre-snap motions, the mini “chess” game that happens pre-snap is actually a fascinating thing to watch. Peyton Manning was a brilliant tactician of it, and we’re seeing more and more quarterbacks utilize more time pre-snap to try and put their teams in the best position to succeed on a play-by-play basis.
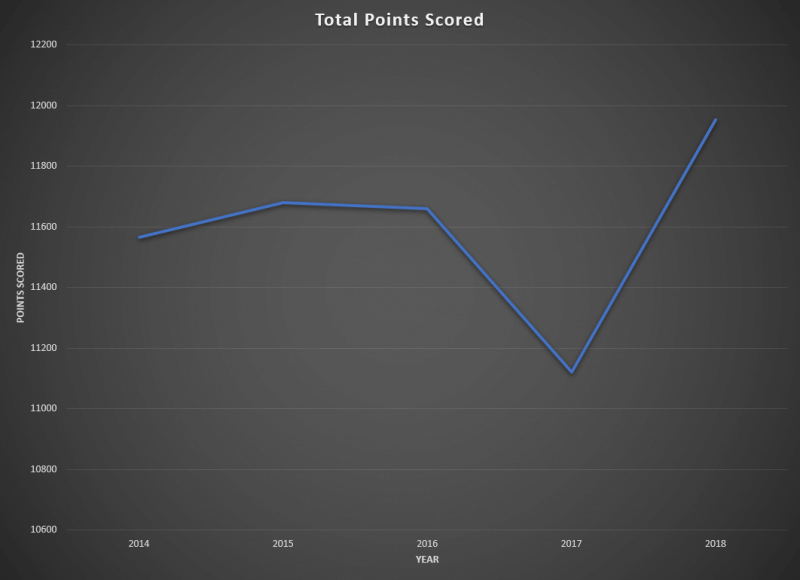
Improved League-Wide Efficiency
Despite a consistent decrease in total play volume, teams scored more points during the 2018 season—on fewer plays(!)—than they have over the past five years.
Perhaps a cleaner way of illustrating this is via a table showing how often drives finished with scoring (field goals or touchdowns), and how many points were accrued per drive.
| Year | % Scoring Drives | Pts/Drive |
|---|---|---|
| 2014 | 34.1% | 1.83 |
| 2015 | 34.3% | 1.84 |
| 2016 | 35.6% | 1.91 |
| 2017 | 33.8% | 1.78 |
| 2018 | 36.5% | 2.00 |
We can confidently say that while play volume was down in 2018, there has been a league-wide uptick in terms of scoring efficiency and putting more points on the board.
Can this information help us in fantasy football?
Are Teams Passing More?
We can start by breaking it down into simple run/pass ratio. Is the league trending towards passing or running more?
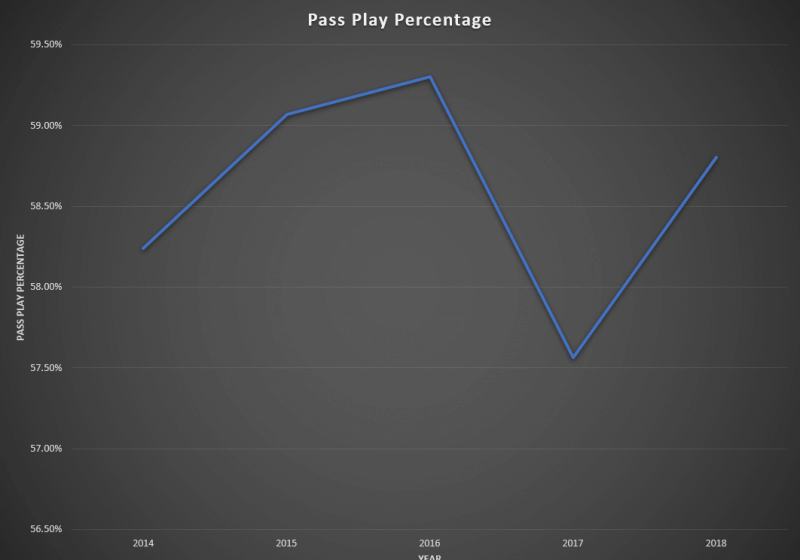
It actually looks like passing is holding relatively stable, with a five-year average of 58.6%. That’s a noticeable jump from the early part of the decade (53.6% in 2010) but it looks like it’s holding steady just under the 60% mark over the past few years. That’s helpful in terms of future projections with minimal year-over-year change in terms of play calling.
So if we’re not seeing any significant changes in play calling, what has led to this uptick in league-wide efficiency?
Redistribution of Passing Attempts
As we continue into a more strategic and analytical era of football, it looks like teams are no longer just force-feeding their top alpha wide receivers.
| Year | WR1 Tgts | WR2 Tgts | WR3 Tgts | RB1 Tgts |
|---|---|---|---|---|
| 2014 | 148.0 | 124.3 | 110.2 | 62.6 |
| 2015 | 162.0 | 127.7 | 106.3 | 56.6 |
| 2016 | 142.5 | 126.7 | 112.2 | 58.3 |
| 2017 | 144.2 | 114.4 | 96.5 | 80.3 |
| 2018 | 152.6 | 109.6 | 97.8 | 86.8 |
In terms of fantasy positions, the WR1 position (top-12 fantasy wide receivers) has held relatively stable in terms of targets.
The lesser alpha WR2s, are becoming the victim of what looks like a league-wide redistribution of targets. Outside of the rare breeds in the DeAndre Hopkins and Michael Thomas tier, lesser top-shelf wideouts (those typically outside the top-12), find their targets being distributed all over the field. This increase in diversification of the passing game has led to more targets being taken from the fantasy WR2’s and WR3’s and trickling down to more targets to the running back position.
The drop in WR2 and WR3 targets over the past two seasons (down 31.8 collective targets) can likely be attributed to an increase in targets at the running back position (up 28.5 targets).
Targets to the running back position are generally high-percentage in nature (shallow average depth of target) and are typically designed for the back to get the ball in space and pick up additional yardage after the catch. More and more coaches are utilizing the running backs in the receiving game, leading to these versatile do-it-all backs turning into must-haves for fantasy players to own. We’ve seen over the past few seasons that the 20-30 targets that WR2’s/WR3’s used to receive have shifted to the RB1 position. With the average target worth approximately 2.75 times as many fantasy points as a rushing attempt, you can see why this influx of receiving work is not only noticeable but important to a winning fantasy strategy.
We’re also seeing a sizeable number of targets move toward the middle of the field, raising the fantasy prominence of the slot receiver. Slot receivers generally have less press coverage due to the flexibility in their routes going both inside and outside. The throws in their direction are generally also low in average depth of target by nature, thus less difficult to catch. This is why we also see high catch percentages associated with these types of receivers.
Over the past few years, we’ve seen a higher number of targets rise for the slot receiver position. Last season there were 84 wide receivers that saw at least 50 or more targets. 23 of those 84 saw 50 or more targets solely from the slot, a noticeable uptick from 2015 where there were just 14 wide receivers that fit that subset. The average catch percentage for these 23 receivers was 71.1%. The average catch percentage for all 2018 wideouts (min. 50 targets)—excluding these heavy slot receivers—was down at 60.8%.
Intuitively, this makes sense due to the previous reasons laid before you. It’s just nice to see the #math back up the claim. These types of receivers are a great source of steady production in PPR leagues and make for terrific bye-week replacements.
As we enter the 2019 season, we’re starting to see fewer teams blindly target their top wideout. Instead, teams are playing the matchups and targeting the player with the best individual matchup on a play-by-play basis. While this waters down the fantasy value of WR2s and WR3s, it’s led to a league-wide uptick in scoring efficiency. That likely means it isn’t going away anytime soon.
The Big Three at Tight End
One final note on the 2018 campaign was the massive difference between the top tier of tight ends and the rest of the position. Travis Kelce, Zach Ertz and George Kittle had incredible seasons in 2018. If we were to compare their respective fantasy points across all FLEX positions, here’s how each performed:
| Tight End | TE Finish | Targets | Rec | Rec Yds | Rec TDs | PPR Points | FLEX Finish |
|---|---|---|---|---|---|---|---|
| Travis Kelce | TE1 | 150 | 103 | 1336 | 10 | 296.6 | FLEX14 |
| Zach Ertz | TE2 | 156 | 116 | 1163 | 8 | 280.3 | FLEX16 |
| George Kittle | TE3 | 135 | 88 | 1377 | 5 | 255.7 | FLEX23 |
Injuries and youth have created this massive tier gap between “the big three” and the rest of the tight ends. We haven’t seen a tight end score more than 255.7 PPR points since 2014. Three of them did that in 2018. They are subsequently being drafted inside the top-three rounds in early best-ball drafts. All three of these tight ends finished inside the top-24 of fantasy scorers in the 2018 season. That’s unreal. Kelce scored at least double-digit fantasy points in all but one week. Ertz set the tight end record with 116 receptions in a single season. Kittle led all skill position players in yards after the catch (873).
While this is a game-winning strategy for best-ball leagues (especially with FFPC’s 1.5-point TE premium setting), it will cost you a premium pick. I have no problems with someone chasing one of these stud tight ends (preferably after securing a top-shelf RB1 in the first round), but if you miss out on one, don’t chase the next tier. History tells us there will be very little difference among Tier-2 tight ends.
Key Takeaways
- Scoring is on the rise - Feel free to hit the overs early in September before Vegas learns to adjust.
- Invest in do-it-all backs - Running backs that are adept at both running and catching the ball have significantly more value than their counterparts. Instead of spending a draft pick on someone like a one-dimensional LeGarrette Blount, fill your bench with potential three-down backups that are an injury away from starting. Examples: Giovani Bernard, Chase Edmonds
- Slot receiver usage is on the rise and is a source of high-end receiving efficiency - With more and more receivers being utilized all over the formation, take a few late-round darts on slot receivers that show promise. Examples: Nelson Agholor, Trey Quinn
- Elite tight ends are going to be costly this year - Following any season, the masses tend to overreact and expect results to repeat themselves. If you miss out on one of the top three, there are plenty of value tight ends to take instead of reaching and trying to chase Eric Ebron’s 13 touchdowns. Examples: Vance McDonald, Jack Doyle


