Leveraging Weekly Player Consistency in Daily Fantasy Football

"You get pseudo-order when you seek order; you only get a measure of order and control when you embrace randomness." - Nassim Nicholas Taleb
The weekly fantasy production of each NFL position -- and different types of players within that position -- tends to have varying degrees of volatility.
Some positions and players have a wider range of outcomes than others -- in other words, some positions and players are more volatile (or less consistent) than others.
It is crucial to understand these ranges of outcomes, or you may be unknowingly exposing yourself to more risk than you intended to, or not exposing yourself to enough upside.
How to Measure Weekly Consistency
A good way to measure this volatility is to calculate the coefficient of variation (CV), which is simply the standard deviation divided by the mean. The lower the result, the less volatile (or more consistent).
First, let's examine the weekly consistency inherent to each NFL position, using FanDuel and DraftKings scoring1:
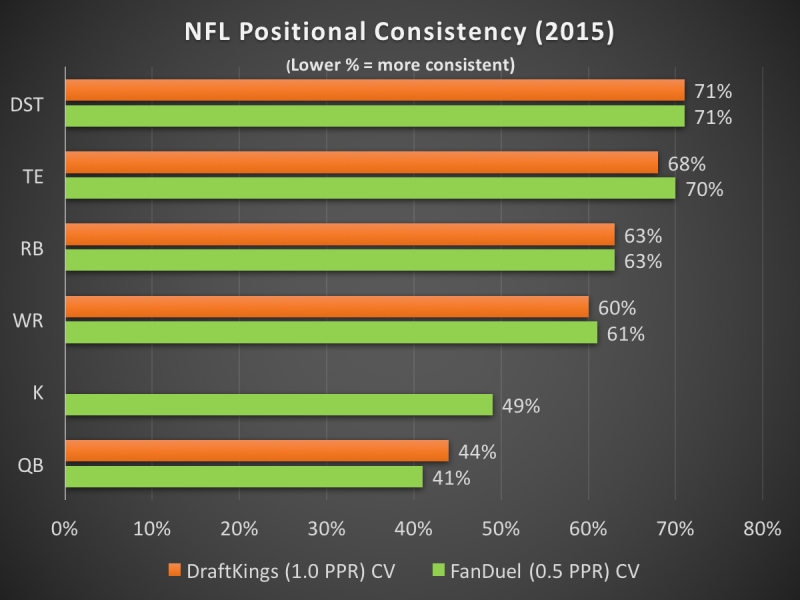
What the chart above is saying is that a player's range of weekly outcomes deviates from their seasonal average by whatever percentage the CV is.
For instance, quarterbacks on DraftKings will tend to post weekly totals 44 percent above or below their seasonal average of DraftKings points per game, on average.
The implication is that a player could average (or be projected for) a certain amount of points, but have larger or smaller range out outcomes depending on the level of volatility inherent to his position.
Here is an example, using a 10-point-per-game FanDuel average:
| Pos. | PPG Avg. | CV | Low | High | Range |
|---|---|---|---|---|---|
| D/ST | 10.0 | 71% | 2.9 | 17.1 | 14.2 |
| TE | 10.0 | 70% | 3.0 | 17.0 | 14.0 |
| RB | 10.0 | 63% | 3.7 | 16.3 | 12.6 |
| WR | 10.0 | 61% | 3.9 | 16.1 | 12.2 |
| K | 10.0 | 49% | 5.1 | 14.9 | 9.8 |
| QB | 10.0 | 41% | 5.9 | 14.1 | 8.2 |
As you can see, even with the same exact point-per-game average, some picks are safer than others, but the ones that are the riskiest also have the greatest upside.
Strategic Takeaways
Of course, these are just averages being looked at in a vacuum, and players within each position have varying levels of volatility. I'll explore why that is on a position-by-position basis later on, but first, here are some implications of the overall positional consistency as it relates to strategy, followed by implications from an explanatory, predictive, and strategic perspective, which all go hand-in-hand.
Quarterback Weekly Consistency
Quarterbacks are the most consistent position and generally have the smallest range of outcomes (relative to the average) of all fantasy positions. Therefore, it makes sense to avoid overpaying for stud quarterbacks in tournaments -- they don't have as much upside relative to their normal output, and thus, relative to their salary. For example, over the last three seasons, there have been 69 40-point games on DraftKings, but only 13 of those (18.8 percent) were produced by quarterbacks. And while you will, in theory, get a higher floor from an expensive quarterback -- seemingly ideal for cash games -- expensive quarterbacks aren't necessarily useful there, either. Inevitably, there will be a few cheap quarterbacks who, for whatever reason (such as playing against the Saints defense), are projected to outperform their normal average. Since quarterback inherently has a high floor, there would be no need to shy away from these value quarterbacks, knowing that their increased projection is reliable despite their cheap price tag and (likely) lack of previous high-level production. Whether I'm in a cash game or tournament, I find that locking in a cheap quarterback allows me to then spend salary on other positions where more roster spots are required and the consistency or upside I'm seeking will be harder to find cheaply.
Running Back & Wide Receiver Weekly Consistency
When I first started studying CV in 2013, running backs were significantly more consistent on FanDuel (CV of 56 percent from 2013-14). But over the past three seasons, the NFL has set new records for passing volume and efficiency each year. Since running backs are reliant on volume to consistently produce in fantasy, I'm operating under the assumption that the shift towards greater volatility is here to stay. Although running backs are now equally volatile as wide receivers (or perhaps more so), the top wide receivers tend to score more than the top running backs: over the past three seasons, wide receivers have scored 30 DraftKings points 202 times and scored 30 FanDuel points 74 times; running backs have done so just 101 and 38 times, respectively. Therefore, I prioritize spending at wide receiver even in tournaments. (It helps that running backs slated to see high volume are easier to find at an inexpensive price tag due to the high frequency of injuries at the position.)
Tight End Weekly Consistency
Tight ends are less consistent relative to every position except D/ST. Due to their resulting low floors, I almost never pay up for tight ends in cash games, a strategy which has paid dividends thus far in my DFS career. If the league-wide emphasis on passing continues, perhaps the tight end position will be featured even more and thus grow more consistent collectively, but in the near future, I expect tight ends to continue to be the most volatile of the four skill positions. If I'm going to pay up for a tight end, I'm almost always going to do so in a GPP.
Kicker & Defense/Special Teams Weekly Consistency
Kickers have an undue reputation for being difficult to predict, but they are actually one of the most consistent positions and vary in predictable ways (Vegas lines are extremely accurate at forecasting kicker production). Given the relative consistency of kickers and the relative volatility of D/ST, there's no need to shy away from selecting a relatively expensive kicker in FanDuel cash games. However, given that you can also trust the floors of the lesser-priced options at kicker, I tend to prioritize paying for a D/ST over kicker even in cash games. I'm willing to risk the relatively low salary expenditure to bet on my preferred D/ST being able to land on the high end of its range of outcomes. In general, I tend to employ what Nassim Taleb refers to as the barbell strategy in cash games, paying up for as many highly consistent players as I can, and then being willing to select more volatile players with higher upside at the lower end of the salary spectrum. This allows me to still have a consistent core while giving me extra upside to thoroughly crush overly risk-averse cash game players in head-to-head matchups.
Using Weekly Consistency as an Explanatory Metric
By understanding which positions and stats have the greatest and fewest range of outcomes, we can better judge how close past performance is to a player's "true" baseline and which stats are likely to regress.
For instance, if a quarterback averaged 20 points per game over the last month, you can be a lot more confident that 20 points per game is near to his "true" baseline than you could if a tight end did so.
The same is true on an individual stat level. As you'll see in the subsequent section, touchdowns are a lot more volatile than yardage, so if a receiver averages 80 yards and 1.3 touchdowns per game, you can trust that the 80 yards are a lot closer to his "true" yardage baseline than the 1.3 touchdowns are to his "true" touchdown baseline.
Salary increases generally take past production heavily into account, so keeping in mind which stats are closer to being "true" and which are more likely to be due to inherent volatility (and thus likely to regress) can help you make a more accurate assessment of whether a salary rise or drop is warranted.
Using Weekly Consistency as a Predictive Metric
Volatility not only provides insight into what a player's "true" baseline might be (which obviously helps when building projections), but it also provides insight into how volatile projections themselves might be.
Remember how quarterbacks are a lot more consistent than tight ends? That means you'd put a lot more stock in a projection of say, Carson Palmer, than you would of say, Julius Thomas. This brings us to the strategic element...
Using Weekly Consistency to Make Smarter Lineup Decisions
By understanding the range of outcomes for each player, you gain an understanding of not only how often you yourself is likely to be wrong, but also how likely everyone else is likely to be wrong.
These days, most sharp DFS players will have an idea of what level of ownership a player will have, either from experience or from observing Thursday ownership data on FanDuel (4for4 provides this data for DFS subscribers). When a player is likely to be highly owned, it's prudent to keep in mind the player's range out of outcomes and how it will apply to the specific game type you're playing.
For example, in a cash game, you might not want to fade that highly owned quarterback who is a great value, because it's highly likely that your competitors are correct about the pick. If there's a tight end or D/ST projected to be highly owned, you can feel more comfortable about a potential fade. In a tournament, you could use the fact that quarterback will be highly owned against your competitors: Anyone who owns the popular quarterback will in essence be locking themselves into the same small range of outcomes, so you have extra incentive to be contrarian simply to expose yourself to a slightly different range of outcomes.
How Consistent is Each Individual Stat Category?
Below are the individual CVs broke down by position. You will notice that opportunity volume stats are more consistent than yardage volume stats, which are more consistent than touchdowns.
Quarterback Individual Stat Category Consistency
| QB Stat | CV |
|---|---|
| Pass Attempts | 28% |
| Total Yards | 29% |
| Completions | 30% |
| Passing Yards | 31% |
| Total TDs | 70% |
| Passing TDs | 72% |
| Interceptions | 117% |
| Rushing Yards | 130% |
| Rushing TDs | 191% |
As you'll see as you go through the rest of the positions, a quarterback's yardage is significantly more consistent from week to week than that of any other position, which is due, of course, to the fact that quarterbacks do not have to compete with other players at their position for market share of their team's production (and also to the fact that nearly every team passes at least as much as they rush, and on the teams that do rush the most, quarterbacks are usually involved in that area as well).
One interesting note is that while rushing yardage and touchdowns for quarterbacks are volatile on average, total yardage and total touchdowns are essentially just as consistent as passing stats. The volatility of the rushing stats is mostly due to the quarterbacks that don't rush very often. It would be wrong to mistakenly conclude that a quarterback that relies on rushing production is more volatile -- the more accurate conclusion is his yardage and touchdowns will be consistent on a weekly basis, even if the allocation of passing-to-rushing stats varies.
Running Back Individual Stat Category Consistency
| RB Stat | CV |
|---|---|
| Rushing Attempts | 43% |
| Total Yards | 55% |
| Rushing Yards | 65% |
| Receptions | 82% |
| Receiving Yards | 106% |
| Total TD | 160% |
| Rushing TDs | 163% |
| Receiving TDs | 196% |
As with quarterbacks, total yardage and total touchdowns are more consistent than yardage and touchdowns that are broken down individually, in this case into rushing and receiving.
What's noteworthy about running backs is that even though they generally have fewer players to compete with for opportunities than wide receivers do, running back touchdowns are more volatile on a weekly basis than wide receiver touchdowns (and rushing attempts are slightly more volatile than wide receiver targets as well). Running back receptions are also by far the most volatile of any pass-catching position.
Wide Receivers & Tight End Individual Stat Category Consistency
| WR Stat | CV |
|---|---|
| Rushing TDs | 16% |
| Targets | 41% |
| Receptions | 48% |
| Receiving Yards | 59% |
| Rushing Attempts | 79% |
| Rushing Yards | 90% |
| Receiving TDs | 151% |
| TE Stat | CV |
|---|---|
| Targets | 47% |
| Receptions | 54% |
| Receiving Yards | 65% |
| Receiving TDs | 178% |
Targets correlate with wide receiver production more than any other stat (that does not directly comprise fantasy points), and the fact that targets are also one of the more consistent stats provides more evidence as to why they should be emphasized when projecting wide receivers.
The relationship between the CV of receptions, receiving yards, and receiving touchdowns explains why certain types of receivers are more consistent than others. Deep threats that rely on registering a high amount of yards per reception are generally less consistent (think Torrey Smith), while short-area slot receiver types that rely on registering a high amount of receptions even if their yards per reception figure is low tend to be more consistent (think Jarvis Landry).
The same is true for tight ends, except they are more volatile than wide receivers across the board, because as I mentioned earlier, most tight ends are not featured in their offense to the extent that wide receivers are.
Kicker Individual Stat Category Consistency
| K Stat | CV |
|---|---|
| Extra Point Attempts | 57% |
| Extra Points Made | 60% |
| Field Goal Attempts | 68% |
| Field Goals Made | 74% |
Kicker fantasy point CV (49 percent) is less volatile than field goals or extra points individually, which intuitively makes sense because when a teams get into scoring range, sometimes they'll score a touchdown, while other times they will end up settling for a field goal. That is why it's important to target kickers on teams projected to score the most points -- i.e., the teams with the highest Vegas implied totals. Trying to predict exactly how may field goals versus extra points a kicker will have is a fool's errand.
Defense/Special Teams Individual Stat Category Consistency
| D/ST Stat | CV |
|---|---|
| Points Allowed | 42% |
| Sacks | 71% |
| Interceptions | 114% |
| Fumble Recoveries | 144% |
| Kick Return TDs | 154% |
| Safeties | 163% |
| Defensive Return TDs | 248% |
Points allowed is a very consistent weekly stat for defenses, which explains why targeting a D/ST whose opponent has a low Vegas implied total is fruitful.
When you combine the fact that sacks are relatively consistent and the fact that sacks allowed are a quarterback trait (more so than interceptions), it makes sense to favor defenses facing a quarterback with a high sack rate in a game where that quarterback may have to pass a lot.
4for4's DFS Subscription accounts for weekly volatility by generating floor and ceiling projections and values based on our industry-leading projections. Our Lineup Generator can optimize based on ceiling, floor, or median projections, ensuring you have the best lineup no matter what contest type you're playing. Sign up or upgrade to the DFS subscription here!
Footnotes
1. Included in the sample were players who played in six or more games. Point per game cut-offs were as follows: quarterbacks who averaged 10.0 FanDuel points per game, running backs/wide receivers who averaged 8.0, and tight ends who averaged 6.0. Running backs who didn't play at least six games in the same role were removed. For example, David Johnson was not included because he started only five games. If a running back started at least six games, games where he came off the bench were removed. For example, only DeAngelo Williams' starts were included.
Related Articles


