3 Similarities Between MLB and NFL DFS

Major League Baseball and the NFL have more in common than you think. If I told you that well-intentioned recent rule changes aimed at increasing player safety caused a coach to remark "Maybe we'll come out wearing dresses tomorrow", or that a shift toward analytics prompted a retired veteran to rant about "a bunch of f---ing nerds running the game", you may be surprised to hear those comments were made about the MLB, not the NFL. By the same token, the two sports -- while drastically different -- share come commonalities in terms of DFS strategy.
Editor's Note: Early Bird Rates for our 2016 NFL DFS Subscription are available NOW! Sign up HERE.
1. Opportunity is Paramount
For most positions in the NFL, volume has a stronger correlation to fantasy production than efficiency -- running backs need touches and receivers need targets. In the MLB, batters need plate appearances.
Opportunity for hitters comes in the form of a high slot in the batting order. The higher in the order a batter is, the more plate appearances he can expect to see, thereby increasing his potential to produce fantasy points. Expected plate appearances for each batting order position are shown in the graph below.1
Plate Appearances Per Game
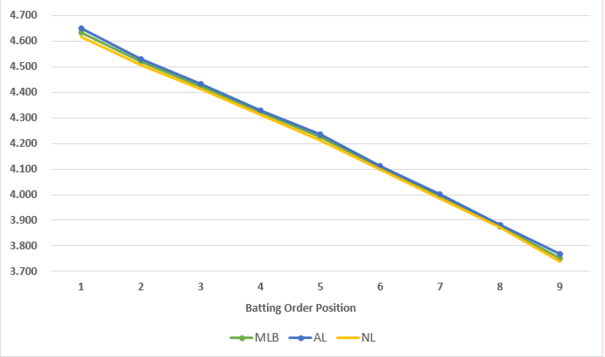
Plate appearances have a strong positive correlation to DraftKings points (0.80) and FanDuel points (0.78) for all qualified batters in 2015, but that should be obvious. In a game where only a few percentage points separate the best hitters from the worst, you need your guy to come to the plate as often as possible. But does a high slot in the batting order actually produce value relative to salary, or are the hitters relegated to the bottom of the lineup the real bargains? To answer, we need to know how batters at each position in the order perform relative to their salary-based expectation.
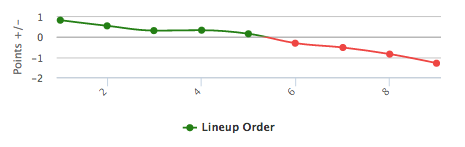
The graphs below illustrate how many fantasy points per game above or below salary-based expectation each position in the batting order scored from 2014 through 2015.2
FanDuel PPG Relative to Salary
DraftKings PPG Relative to Salary
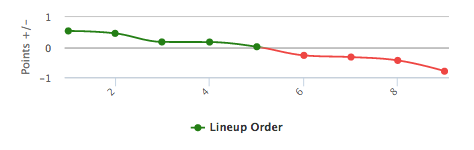
On both FanDuel and DraftKings, batting in the top two slots in the order produced the most value, while batting anywhere lower than fifth produced a negative ROI.
The data is useful for a couple of reasons. Firstly, it tells us we need to target hitters at the top of the order -- particularly those batting first or second -- in cash games. Secondly, it tells us when a shift in the batting order may be valuable to us as DFS players. In addition to the obvious value added when a player is moved from the bottom to the top of the order, the data also illuminates subtle nuances: A move from from sixth to fifth is significantly more valuable than a jump from fifth to third, for instance.
The bottom line: you generally want to target hitters in the top five (ideally the top four) spots in the batting order in cash games. Batters who hit lower in the order are best reserved for going contrarian in GPPs -- like stacking the bottom of the order of a team playing the Rockies in Coors, for example.
Pitchers receive credit for innings pitched, making their opportunity metric simultaneously an efficiency metric used for fantasy scoring and rendering a lengthy data-driven discussion about pitcher opportunity mostly pointless. There are situations where a manager's hook is quicker than usual (i.e. when a pitcher pitches on short rest, for example) or a slower than usual (when the bullpen is worn down, for instance). However, these situations don't necessarily lead to increased fantasy production for a pitcher because of the possibility of him getting shelled late, although being allowed to pitch deep into a game does ultimately increase his strikeout potential, and thus, GPP upside.
2. Vegas Lines Are Important
The Vegas lines are one of the best places to start NFL DFS research, and you’re likely aware of the value of selecting players on teams favored by Vegas to win. Favorites also have the edge in MLB, as can be seen from the data in the tables below.
| FD | DK | |
|---|---|---|
| Favorite | 9.05 | 7.13 |
| Underdog | 8.02 | 6.50 |
| FD | DK | |
|---|---|---|
| Favorite | 32.0 | 16.8 |
| Underdog | 25.2 | 12.4 |
Batters on favorites scored 35 percent and 27 percent more than batters on underdogs on DraftKings and FanDuel, respectively. The contrast wasn’t as stark for pitchers, but pitchers on favorites scored 13 percent and 10 percent more than pitchers on underdogs on FanDuel and DraftKings, respectively.
I’ll spare you the tables and visuals for run totals (similar to an NFL over/under), but the relationships are just as you’d expect: There is a positive relationship between fantasy points and run totals for batters and a negative relationship between fantasy points and run totals for pitchers.
3. Home/Road Splits Are Significant
In NFL DFS, you’d rather have a player playing at home than on the road, all things being equal. The same applies most of the time in MLB DFS (I'll explain momentarily), but either way, home/road splits are significant.
First, let’s get pitchers out of the way because their home/road splits are straightforward: they perform better at home, as you can see in the table below.
| FD | DK | |
|---|---|---|
| Home | 29.77 | 15.37 |
| Visitor | 27.42 | 13.76 |
Batters are where it gets a bit tricky. Batters perform slightly better at home overall, but ideally, you want to target them on the road. No, I didn't smoke too much of whatever Chandler Jones was having; let me explain.
Because home teams don’t have to bat in the ninth inning of wins, precious plate appearances are lost every time they emerge victorious. What you're really looking for is road favorites, who perform better fantasy-wsie than both home favorites and home underdogs. The table below shows the fantasy points per game from 2014 through 2015 for all the possible combinations of home/road and favorite/underdog.
| FD | DK | |
|---|---|---|
| Road Favorite | 9.36 | 7.40 |
| Home Favorite | 8.91 | 7.01 |
| Home Underdog | 8.22 | 6.52 |
| Road Underdog | 8.19 | 6.49 |
There is less variability in batters at home -- they’ll perform solidly whether a favorite or an underdog. Road favorites, however, benefit tremendously from the extra plate appearances they see.
Editor's Note: Early Bird Rates for our 2016 NFL DFS Subscription are available NOW! Sign up HERE.
Footnotes
1. Graph via http://www.smartfantasybaseball.com/2014/10/the-effect-of-batting-order-on-r-and-rbi-production/
2. Graphs courtesy of FantasyLabs.com


